New VirES Service Version out for Xmas
We released VirES for Swarm 1.2 (opens new window) on 21 December 2016, bringing to users improved service utilization comfort, additional visualization elements, and better control over data downloading. This evolution of VirES is responding to new requirement inputs from leading experts in geomagnetic field research to ensure best possible user experience and accurate scientific validation of the service.
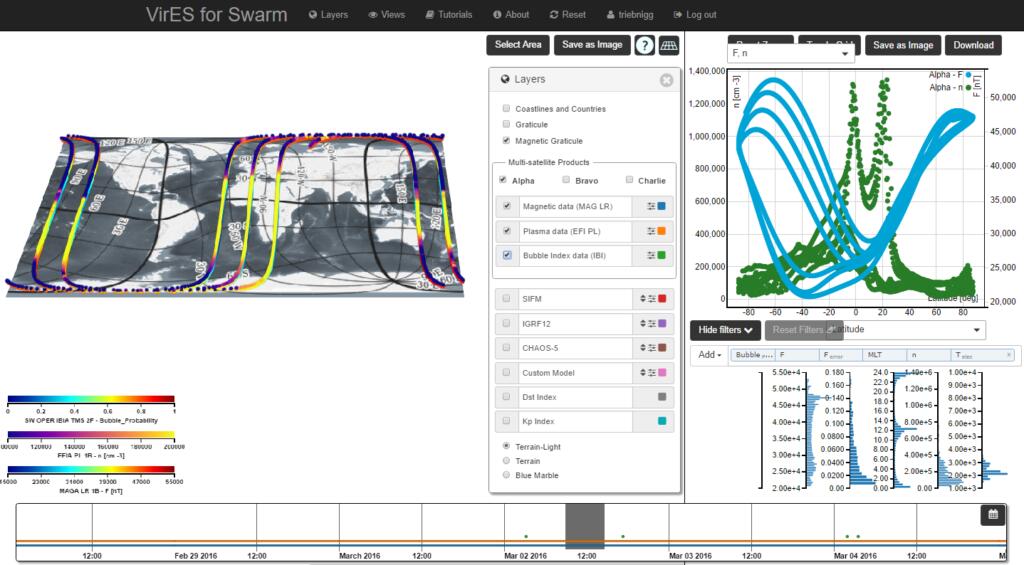
The version 1.2 update brings additional date navigation functions and now supports more precise time filtering for data downloading. An even richer set of color scales and additional geographical overlays (geomagnetic and geographic graticule, geographic borders) can now be included in VirES' attractive data visualizations and publication-ready graphics. Also new is the "personalized view" function through which the service keeps status and preferred configurations from the previous user sessions. Technical details of version 1.2 are described in the service changelog (opens new window).

The virtual research service “VirES for Swarm (opens new window)” adds discovery and visual analytics capabilities to the European Space Agency’s online data access services established for the Swarm geomagnetic satellite mission constellation (opens new window). VirES provides a highly interactive data manipulation and retrieval web interface for the official Swarm product archive and for a number of ancillary data sets. It includes multi-dimensional geographical visualization, interactive plotting, and on-demand processing tools for studying Earth magnetic models and their time variations for comparing them to the Swarm satellite measurements at given global context of space weather. Subsets of Swarm data selected by versatile filtering methods can be downloaded in different encoding formats. The data downloaded can be combined to fit various use cases. VirES is also an environment for preparation of publication-ready graphics and charts through an intuitive and powerful yet customizable interface. An embedded online tutorial introduces the features of the VirES service to first-coming users. A video tutorial (opens new window) is also available: