Saharan dust event from space
# EO Data visualization on the browser
Here at EOX we have already talked about how we manage and visualize data in the browser, here some references to previous blog posts if you want to refresh your memory:
To help us with directly visualizing EO data in the browser we have developed a modular set of tools with the intent of being able to use them interchangeably in multiple projects allowing us to further develop and enhance them based on each of the projects' needs.
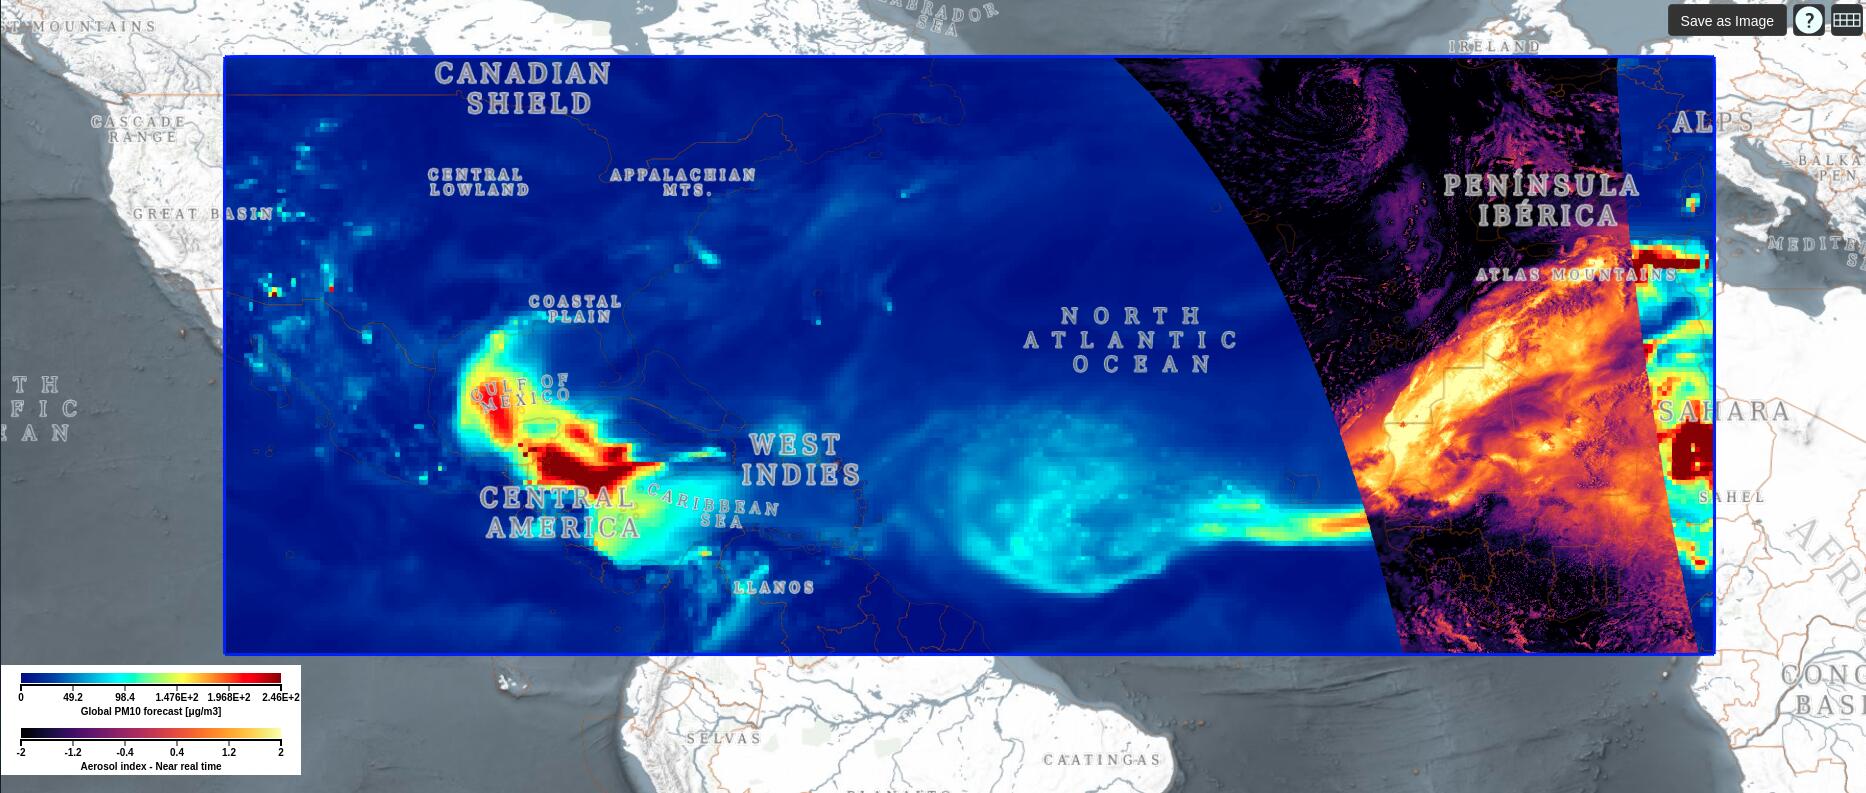
We are very happy to see how well we managed to make use of and integrate our tools in the TOP project as part of the DAVE visualization client, here we see a recent example of visualization of simulation (CAMS) and satellite (Sentinel5P) data over imposed and directly rendered on a 3D globe showing the Sahara dust event from the 24th of June!
On this occasion, we would like to again acknowledge the awesome cooperation with Sistema and ZAMG, our partners in the TOP initiative!
Please allow cookies and disable adblock to load this Tweet.
You can change your cookie settings at a later point in time
here.