VirES for (not only) Swarm - 2021 update
A few days ago a new release of the VirES for Swarm (opens new window) service has been successfully deployed in production. The V3.6.0 is the first release of the service under the new ESA contract which assures the service operations for another two years, with a possible extension up to four years.
Rather than just repeating the new features listed in the service change log (opens new window), I would like to use this opportunity to look back at what has been achieved so far and outline where to evolve in the future.
It is not possible to fit every detail in this short blog-post and thus I will highlight the points according to my own, inevitably subjective preference.
# VirES for Swarm
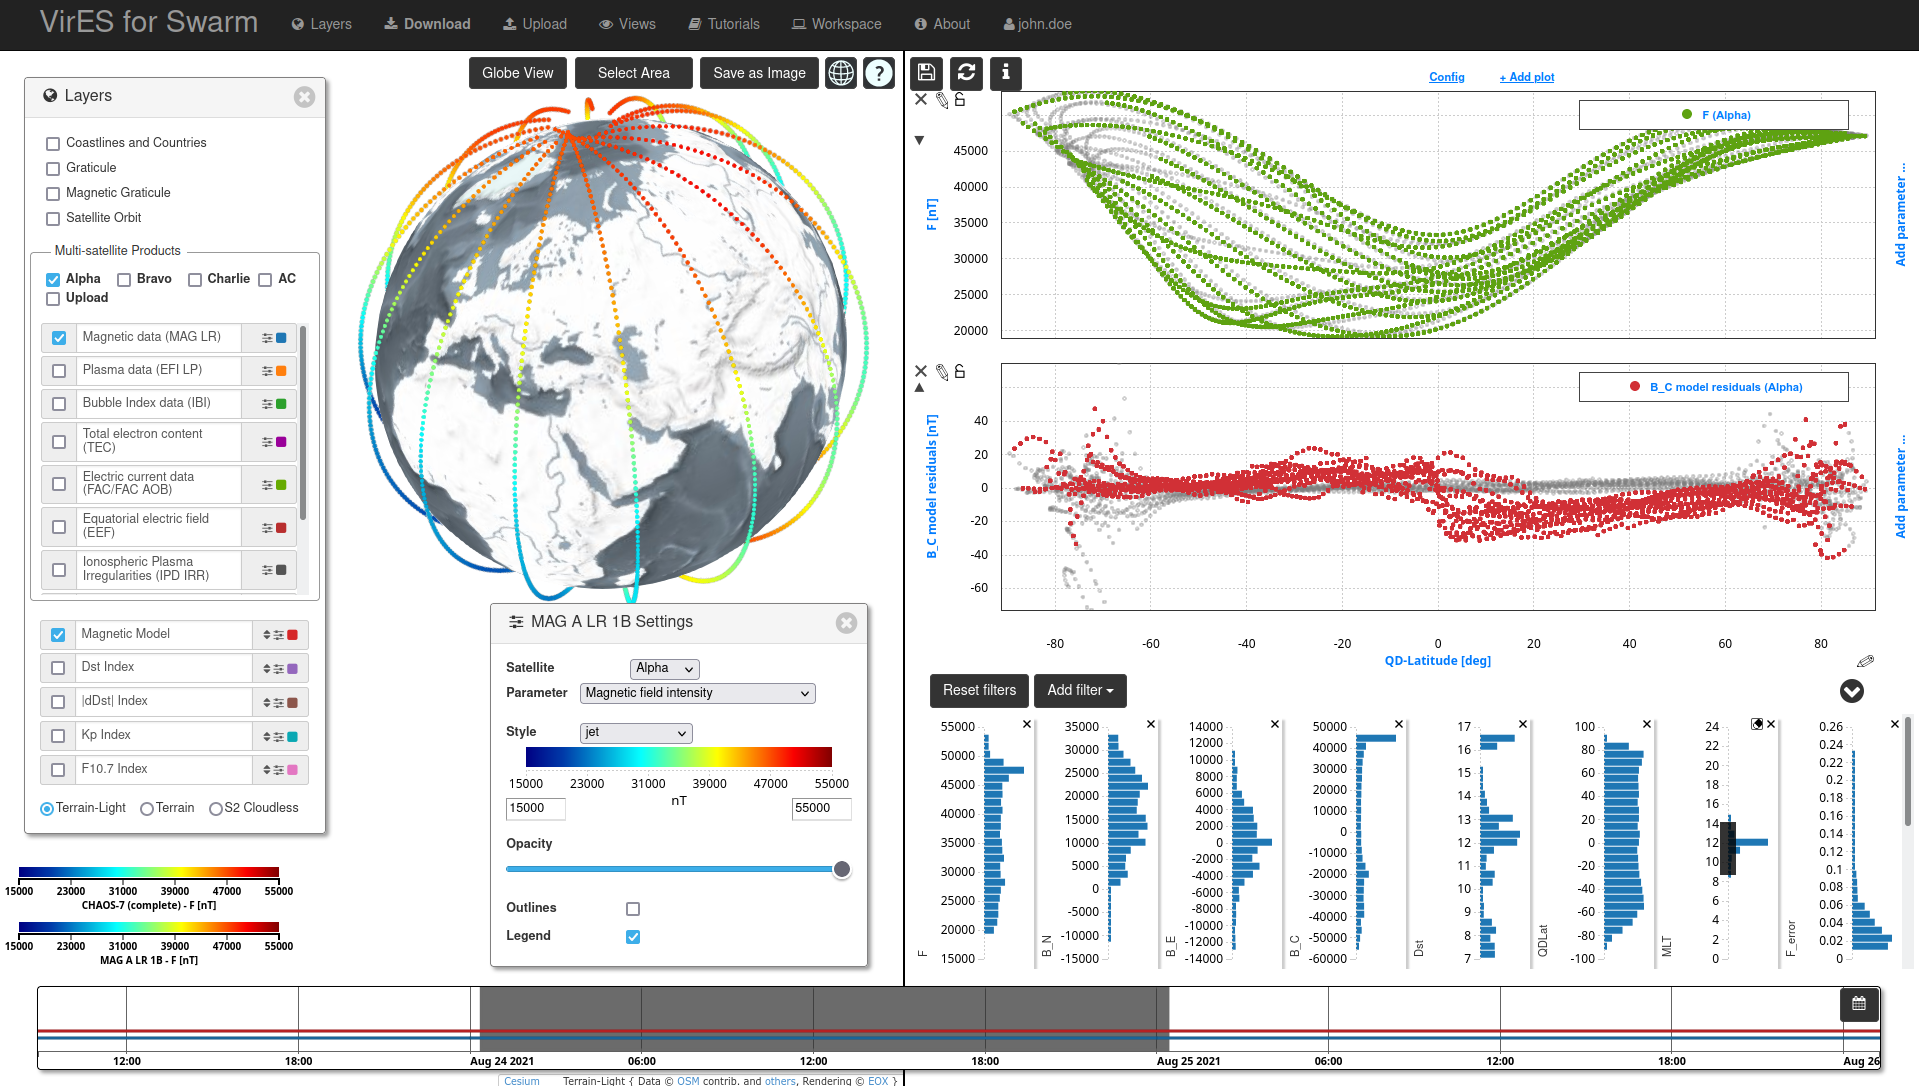
VirES (Virtual workspace for Earth Observation Scientists) started approximately six years ago as a prototype of a web user interface (UI) for visualization of Swarm magnetic field measurements and their comparison with the models (VirES prototype)
The interactive visual web UI and snap on-the-fly evaluation of Spherical Harmonic geomagnetic models, as an alternative to tedious downloading of ZIP files and later in-house processing, attracted the stakeholders' attention and the prototype quickly turned into an operational service.
Over time, VirES for Swarm has grown in size. New Swarm products, geomagnetic models, auxiliary data and UI features have been added to the service. Currently VirES for Swarm holds data from over 119k products in over 70 different collections and over 20 various geomagnetic models (not counting their possible combinations).
The collaboration with scientists, primarily facilitated through the Swarm Data, Innovation, and Science Cluster Swarm DISC (opens new window), helped immensely with steering of the service evolution in the right direction.
# VirES as a Data API
One of the cardinal requirements coming from the scientific users' community was the opening of the VirES for Swarm server API, until then accessible solely by the web UI.
While the on-line web interactive visualization and filtered data download are certainly convenient, they become too restricting for more advanced use cases when the data needs to be fed to users' custom processing which is very much at the core of any scientific research.
In simple words, the users need to get data to their software, without any manual downloads, file manipulations or dealing with superfluous details of the download protocol.
The abstraction of the data access has been the objective of the VirES Python client (opens new window) (see also Ashley Smith's introduction of the Python client). This client allows retrieving of the data from the VirES server with just a few lines of Python code:
from viresclient import SwarmRequest
request = SwarmRequest()
request.set_collection("SW_OPER_MAGA_LR_1B")
request.set_products(
    measurements=["B_NEC"],
    models=["CHAOS-Core"],
    auxiliaries=["QDLat", "QDLon"],
    sampling_step="PT15S"
)
data = request.get_between(
    start_time="2021-08-01T00:00",
    end_time="2021-08-01T01:00"
)
print(data.as_xarray())
2
3
4
5
6
7
8
9
10
11
12
13
14
Processing:  100%|████████████████|  [ Elapsed: 00:01, Remaining: 00:00 ] [1/1]
Downloading: 100%|██████████████|  [ Elapsed: 00:00, Remaining: 00:00 ] (0.08MB)
<xarray.Dataset>
Dimensions:           (NEC: 3, Timestamp: 240)
Coordinates:
  * Timestamp         (Timestamp) datetime64[ns] 2021-08-01 ... 2021-08-01T00...
  * NEC               (NEC) <U1 'N' 'E' 'C'
Data variables:
    Spacecraft        (Timestamp) object 'A' 'A' 'A' 'A' 'A' ... 'A' 'A' 'A' 'A'
    B_NEC_CHAOS-Core  (Timestamp, NEC) float64 2.547e+04 4.683e+03 ... 3.989e+04
    B_NEC             (Timestamp, NEC) float64 2.546e+04 4.662e+03 ... 3.991e+04
    QDLat             (Timestamp) float64 -3.864 -4.848 -5.833 ... 51.36 52.41
    Longitude         (Timestamp) float64 -148.1 -148.1 -148.1 ... 20.53 20.61
    Radius            (Timestamp) float64 6.811e+06 6.811e+06 ... 6.801e+06
    Latitude          (Timestamp) float64 -5.516 -6.48 -7.445 ... 54.98 55.94
    QDLon             (Timestamp) float64 -74.54 -74.38 -74.21 ... 96.33 96.65
Attributes:
    Sources:         ['SW_OPER_MAGA_LR_1B_20210801T000000_20210801T235959_050...
    MagneticModels:  ["CHAOS-Core = 'CHAOS-Core'(max_degree=20,min_degree=1)"]
    RangeFilters:    []
2
3
4
5
6
7
8
9
10
11
12
13
14
15
16
17
18
19
20
The introduction of an alternative programmatic access to the VirES server started a new chapter in VirES history - VirES as a public data API for the Swarm data.
Since then, the programmatic access to the VirES data API has become dominating over the web UI. Some of the datasets such as, e.g., high resolution magnetic products, are even available only through the API without the web UI option. The VirES server API is regarded as a data source reliable enough to be used for systematic production of higher-level Swarm products (e.g., AEJ products).
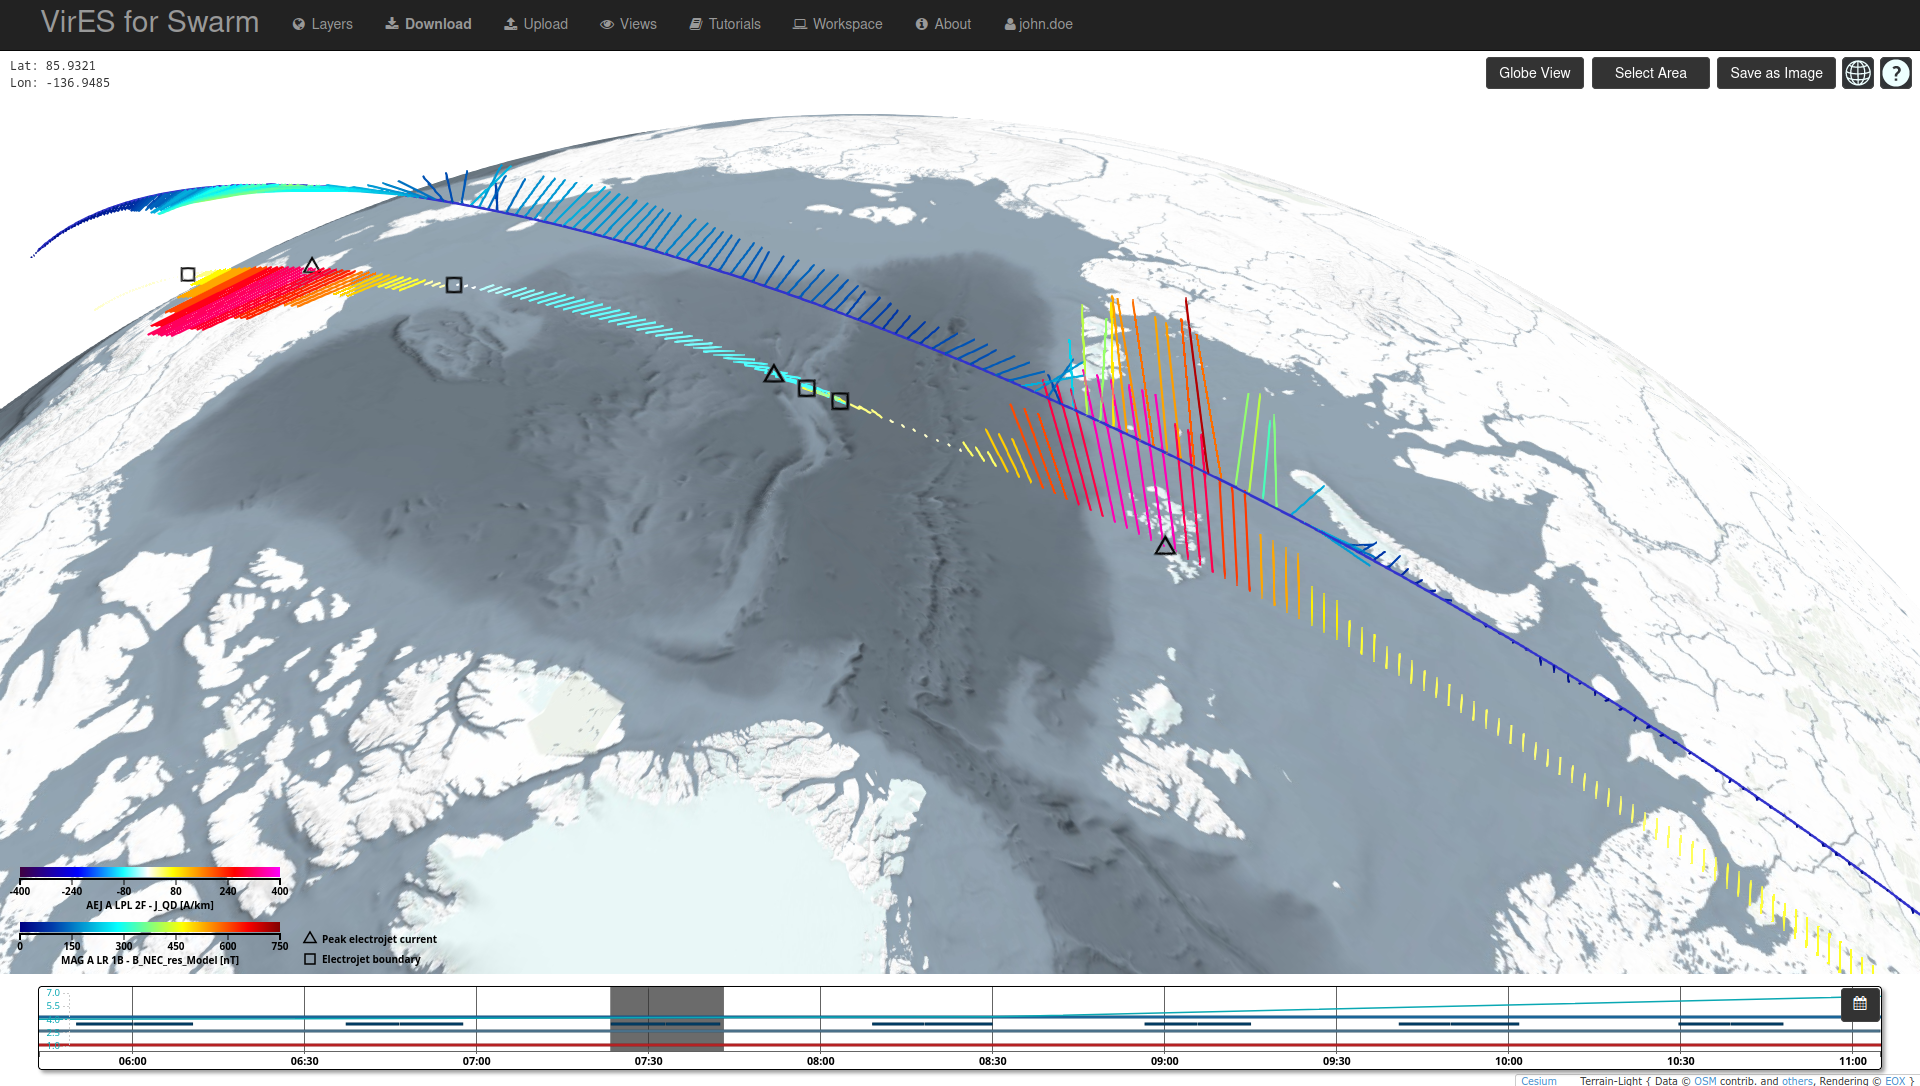
# Beyond Swarm Data
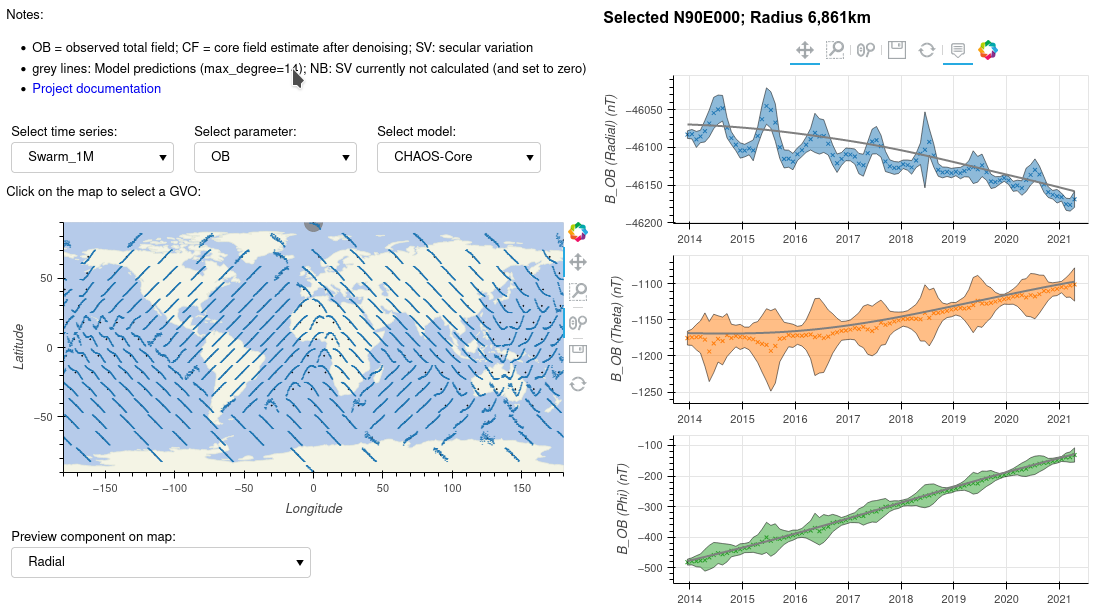
With the most recent August 2021 release update, a couple of new datasets have been added to VirES, among them magnetic field measurements from the CryoSat-2, GRACE, and GRACE-FO missions (see the complete list of VirES data collections (opens new window), following the earlier addition of Geomagnetic Virtual Observatory (opens new window) (GVO) data generated from the magnetic measurements from the CryoSat-2, CHAMP and Ørsted missions and the INTERMAGNET (opens new window) ground magnetic observatory measurements.
"VirES for Swarm" thus no longer serves only Swarm measurements and it is capable of handling time-series from other sensors, no matter whether spaceborne or ground-based.
# Virtual Research Environment - VirES in a Jupyter Notebook
The setup and maintenance of a local Python execution environment may be a challenging task for a less tech-savvy person or a dull distraction for an expert.
To make the writing of custom data processing and visualization Python scripts more accessible the Virtual Research Environment (opens new window) (VRE) - a cloud execution environment based on JupyterHub (opens new window) - has been offered to the users.
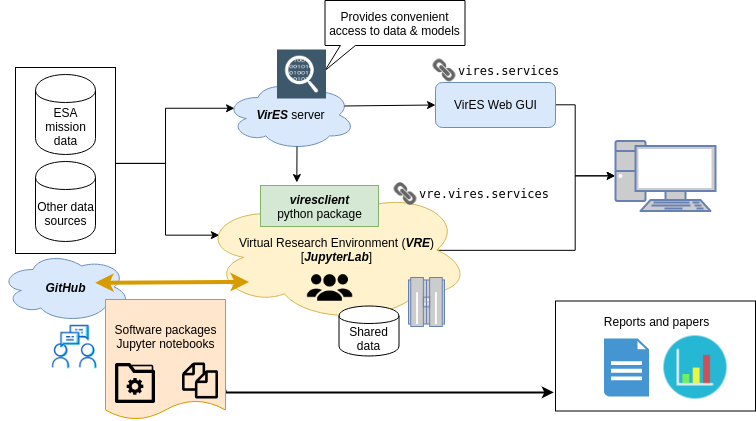
The customized JupyterLab (opens new window) web UI coupled with the pre-installed set of thematic software tools (see VRE details (opens new window)) allow writing and execution of own code right after login to the system.
The executable code in the Jupyter environment is stored in the form of a notebook which can be regarded as a hybrid between a text document and executable script. The notebook consists of a sequence of cells holding text annotations, embedded executable code and results of the code execution.
Jupyter notebooks with the most recent execution outputs can be visualized outside of the Jupyter environment which makes them well suited for generating reports and publishing of reproducible scientific results. Jupyter notebooks can also be shared (e.g., through a GitHub repository) and their copies re-executed by other users supporting the collaboration.
The Jupyter notebooks are also popular for education. E.g., the VRE has been successfully used for training of young scientists at the IAGA Summer School 2021 (opens new window).)
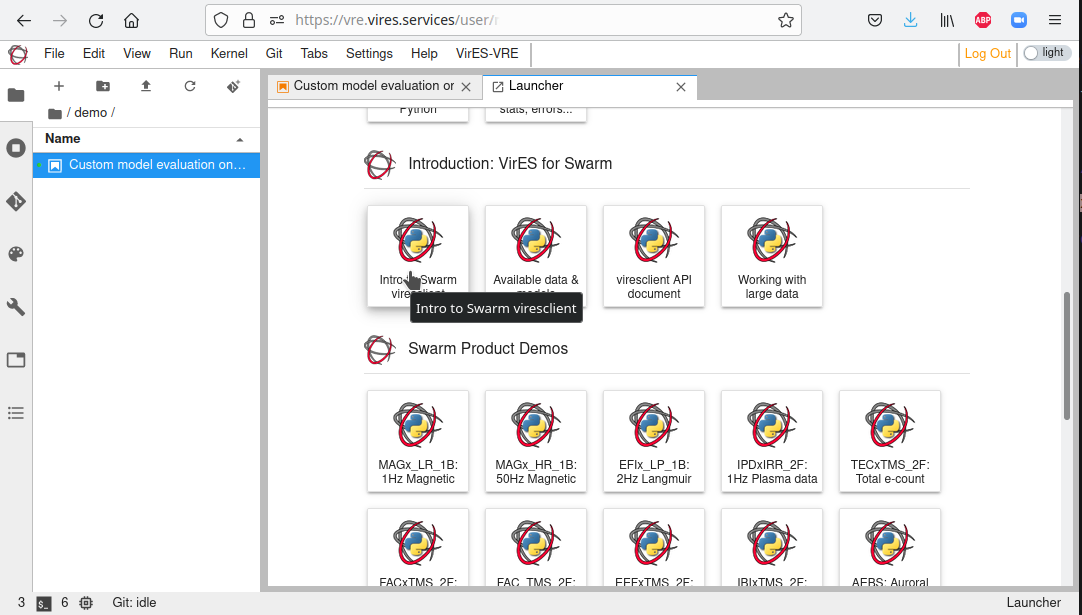
The VRE provides a library of example notebooks (opens new window) demonstrating use of avaiable SW tools and access to the VirES data via the Python client.
# Where to from Here?
The VirES story would not be complete without mentioning our future steps.
# VirES Operations
Clearly, our main objective has always been and will remain to be also in the future to ensure the smooth running of the VirES and VRE services to the satisfaction of both the VirES users and ESA - our paying customer. This depends on the successful service operation and maintenance which are constantly confronted with new challenges - as in any other live service, the hardware breaks, software is buggy and environment keeps changing.
# Interactive Dashboards
One of the challenges we face is the evolution of the VirES web UI. With each addition of a new dataset to the client the UI becomes more complicated and compromises need to be made to fit all possible use cases, departing from the original idea of the "simple app for a single use case".
To a certain degree the situation has been mitigated by the VRE. All advanced visualizations have been routed to a Jupyter notebook, but the bare notebooks often lack the desired level of interactivity. There still seems to be a niche for simple dashboards - single use case interactive apps with predefined controls and easy and intuitive UI, quick to build and easy to maintain, sharing the same VirES server backend.
# New Datasets
We anticipate that additional new datasets will be added to VirES. The Swarm TII and e-POP (Swarm-E) magnetic products are currently being discussed. There might be also other auxiliary features added to VirES, such, e.g, the list of conjunction times for the Swarm A and B spacecrafts soon to be moving on a counter-rotating orbit nearing each other multiple times per day.
# HAPI
The Heliophysics API (opens new window) is a specification of a simple interface for accessing time-series data designed by the scientific community with the ambition to become the common standard for accessing the Heliophysic datasets. There are already several data providers publishing their data via this API (see the known HAPI servers (opens new window))
VirES for Swarm is in the process of adoption of the Heliophysics API (opens new window) on both the consumer and producer sides.
On the client side, the HAPI Python client (opens new window) is already available to the VRE users and we are considering the possibility of adding of HAPI as another data source to the VirES web UI, as alternative, e.g., to the user uploaded data.
We are also in the process of implementation of HAPI as alternative façade to VirES server. HAPI fits well the data model of the VirES server. Although it is limited in terms of the capabilities and thus not a real replacement of the current server API, it has the ability of widening the community of the Swarm data users thanks to the numerous existing clients (Python, Matlab, IDL, R) and acceptance of the API by the Heliophic science community.
Thanks for the writing support to Claudia Schönberger and to Ashley Smith for the re-used graphics.