Building a Python interface to VirES
This post is about a new python tool to interact with VirES for Swarm. VirES comprises three components: - VirES server: provides optimised, flexible access to the original mission data and models - VirES web client (opens new window): a state-of-the-art web-based GUI to interact with data through globe and analytics views - viresclient Python package (opens new window): a new tool to enable easy programmatic access to the data for mission scientists
As for me, I am a PhD student who has been working at EOX as an intern over the summer, developing viresclient. My research is within the field of geomagnetism, making heavy use of Swarm data, and so this post is written more from the perspective of an end user of VirES.
# ESA's Swarm mission
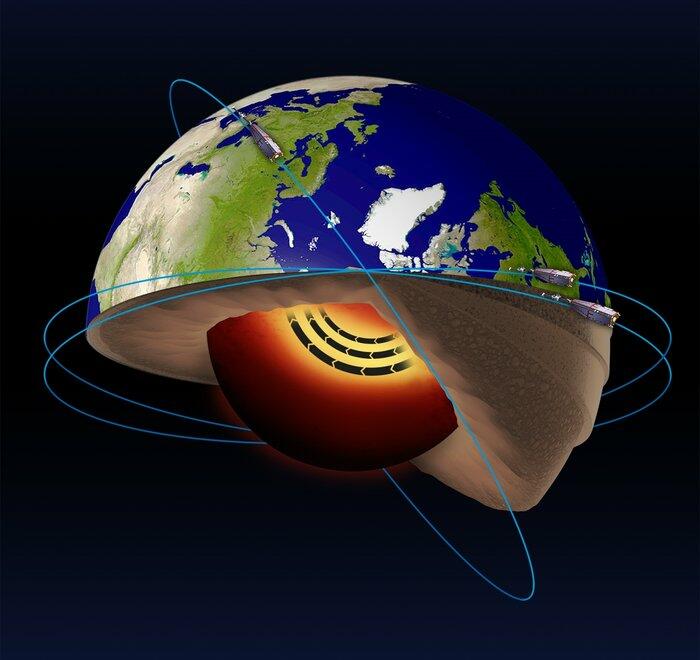
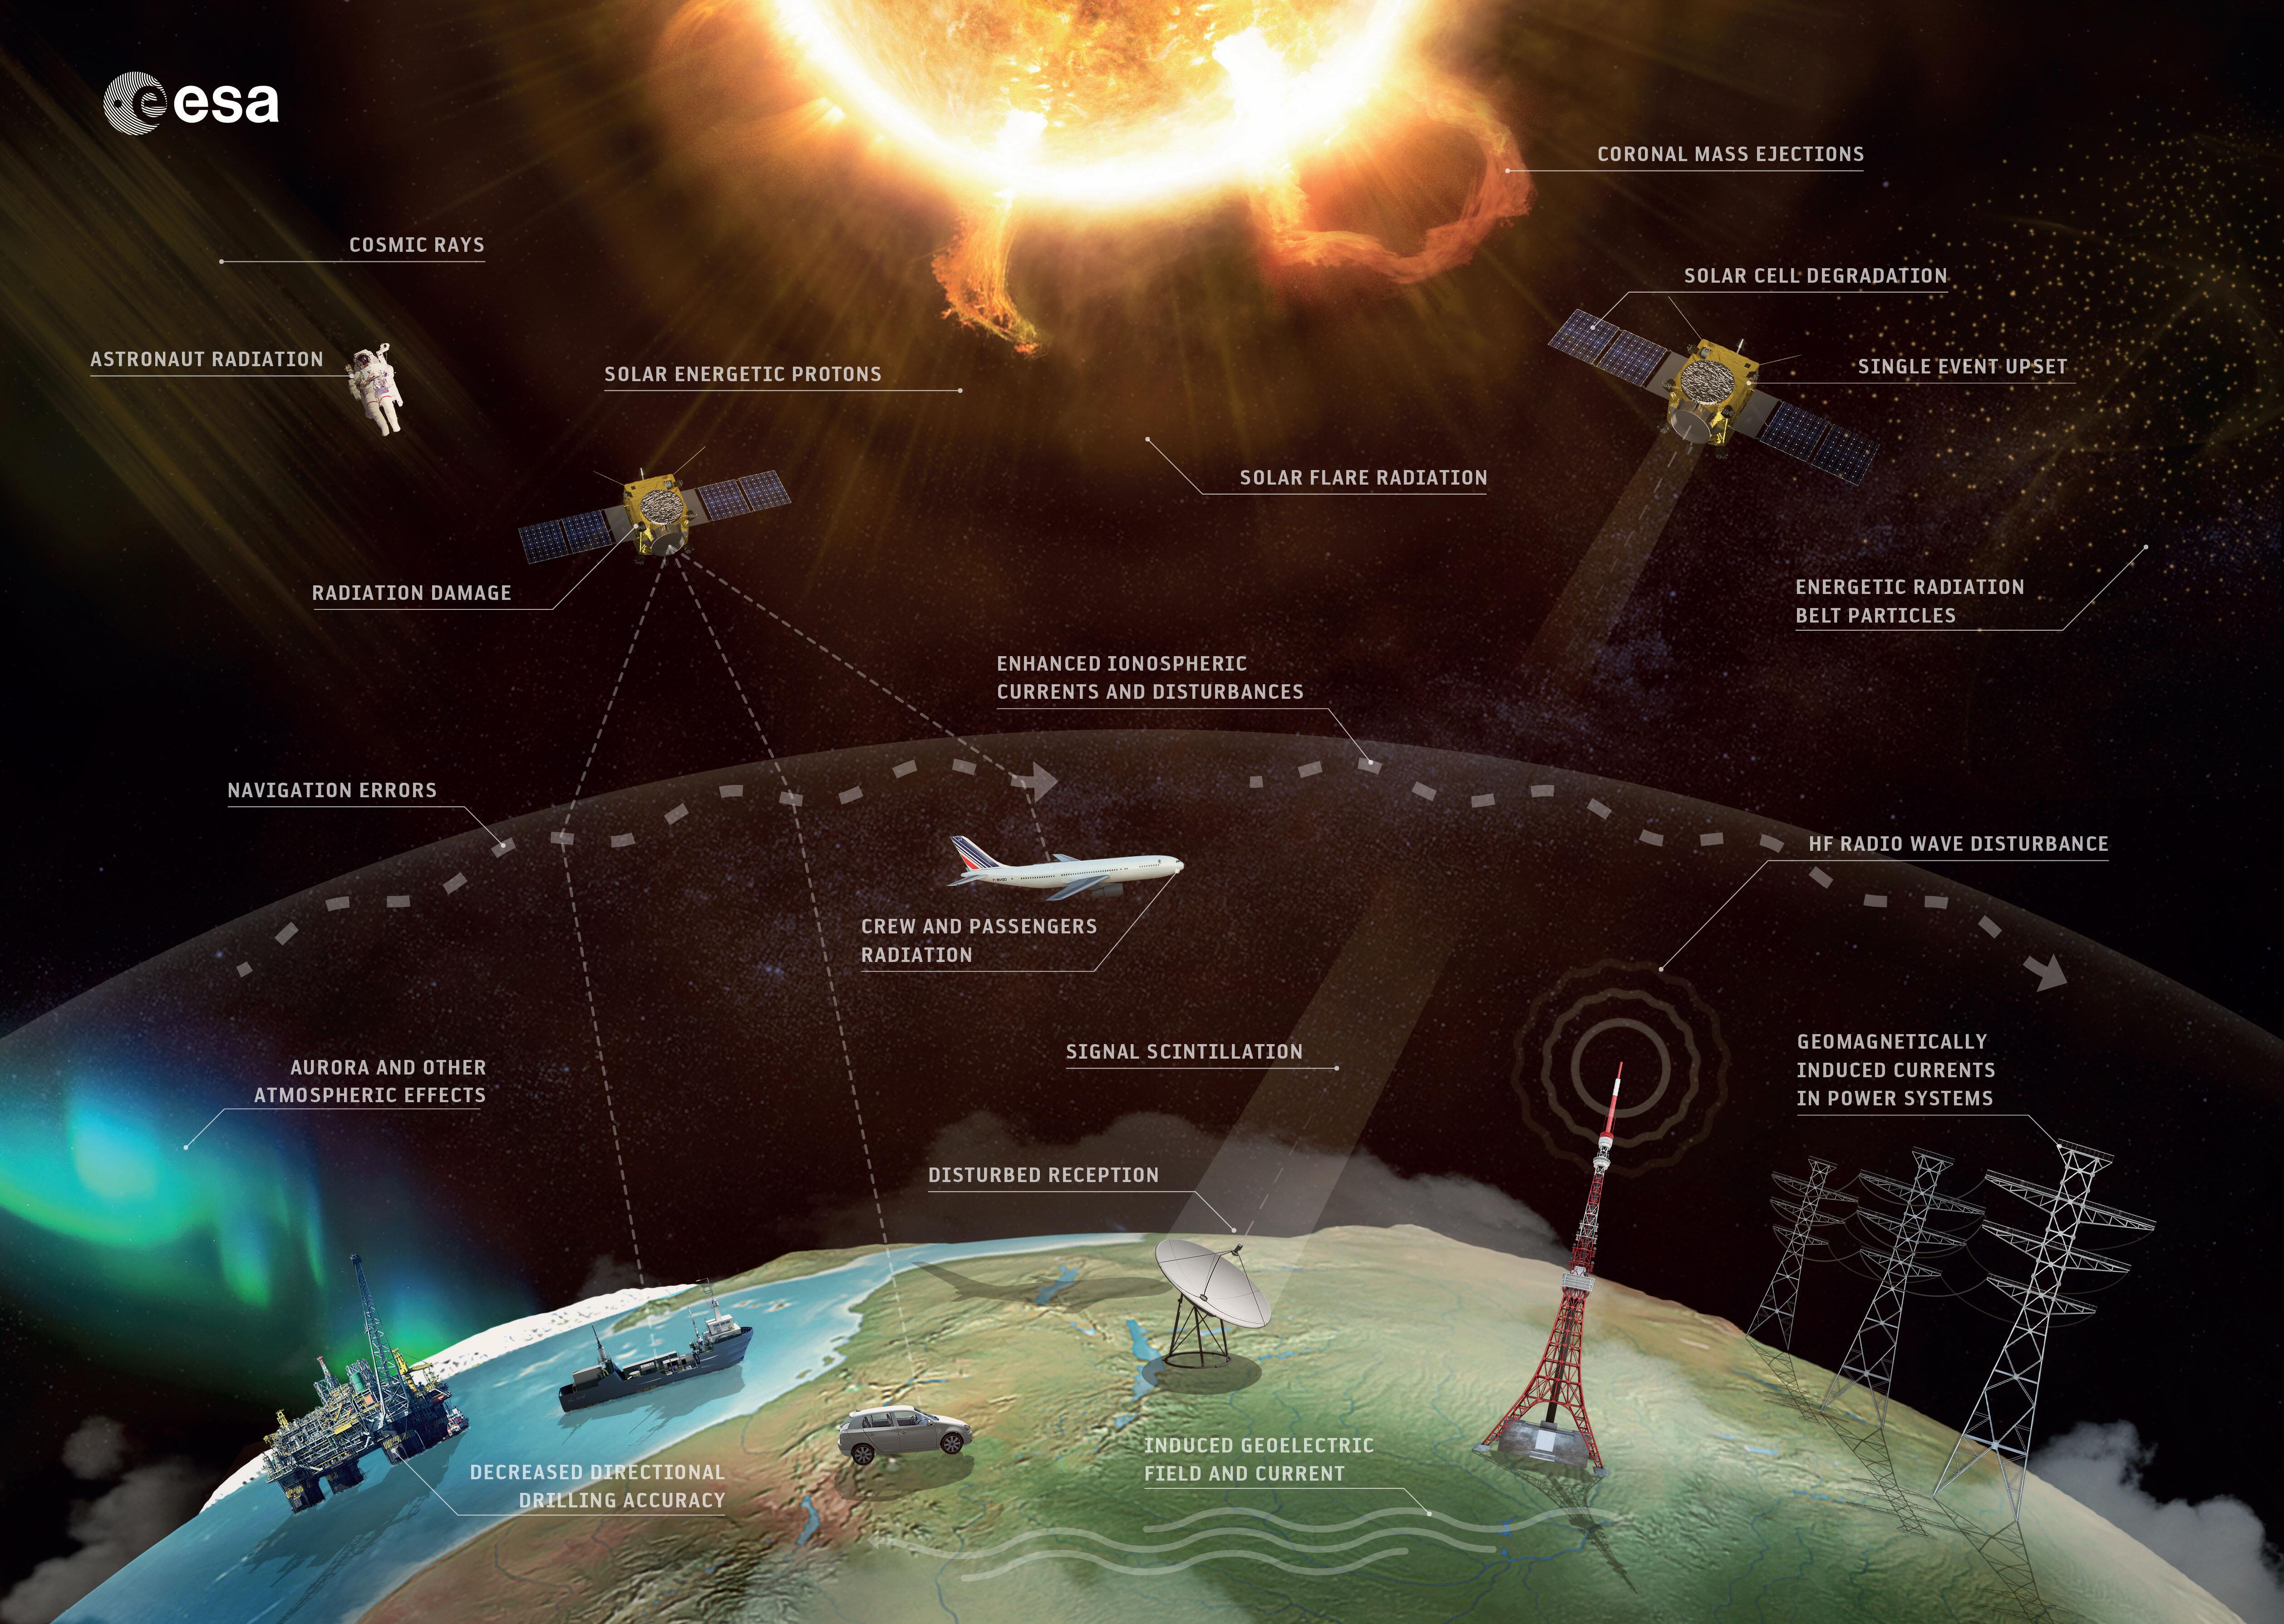
The Swarm satellite mission has been operating in space since late 2013. The mission is actually made up of 3 identical satellites flying in a special constellation in Low Earth Orbit. Its goal is to map and monitor Earth's complex electromagnetic environment which originates in a diverse range of processes, from the movement of material in Earth's core to solar storms energising rings of radiation around Earth. To achieve this, each satellite carries a suite of highly sensitive magnetometers and electric field and plasma instruments, which scientists use to deepen our understanding of processes occurring around our planet. Part of this process involves creating maps of different components of the global magnetic field with unprecedented accuracy. Continued support of Swarm and many other related missions is vital for understanding the Earth system and for protecting society from natural hazards.
# Swarm data access
The Swarm mission produces a range of different measurements and models, which are continually evolving and being added to. As with ESA Earth Observation missions, all data is freely available to all (here (opens new window)). The default way to access data and model parameters is via an FTP server, where different products are presented in a number of (sometimes bespoke) file formats. This means that it is necessary to read through quite a lot of documentation, find or write appropriate software for accessing data files, and sometimes learn how to evaluate different models which may be outside your field of expertise. Accessing Swarm products directly therefore requires particular expertise and a large investment of time. The VirES platform circumvents a lot of this end-user effort and provides more convenient interfaces to the data.
# Overview of VirES
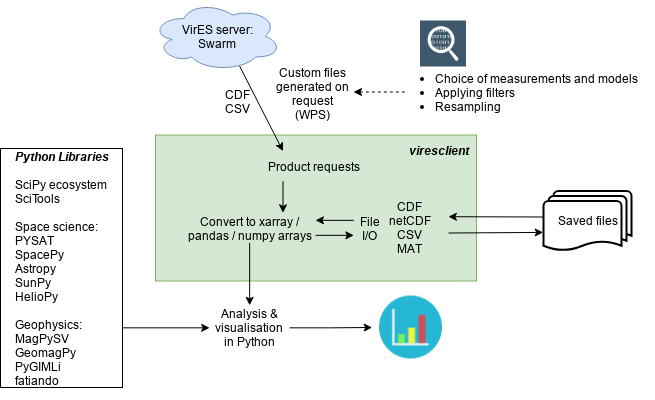
VirES is a server-client architecture which acts as a mediating layer between the raw data and the derived data and visualisations that users want. The VirES server ingests the raw data and model parameters and provides optimised evaluation of models and a request-based access to the data.
For example, I may want to select data measured by a satellite every time it is passing over the arctic during a whole month. Using the "old" method via the FTP server, I would need to download all the files containing this data, read and parse them, subset out the data I want, and, frequently in the case of Swarm data, run some code to evaluate a model along the orbit to obtain the data-model residuals (which can be computationally intensive). I would also need to figure out a sensible way to organise the files. Via VirES, I ask the server for what I want and it delivers it to me in a format I choose, without me having to know the details of the underlying input data format and the model implementation. This also reduces the effort needed in data and code management on my side, making the whole process cleaner and easier to reproduce.
Access to VirES is currently manifested by the VirES web client which allows product selection, filtering, plotting etc. through a GUI with powerful built-in visualisation (see our previous blog post here). This provides an intuitive way to explore the data and understand the products available, with user-friendly tools to generate figures without the need to write your own software.
# Why viresclient?
viresclient is a Python package that provides programmatic access to the VirES server. This provides flexibility and utility in accessing the data. Scripts which make specific requests via viresclient can be built to produce pre-defined outputs, which can be easily tweaked and rerun or made to produce many outputs, in contrast to the point-and-click nature of the web client. This is intended to be complementary to the web client functionality, enabling an additional way to interact with VirES.
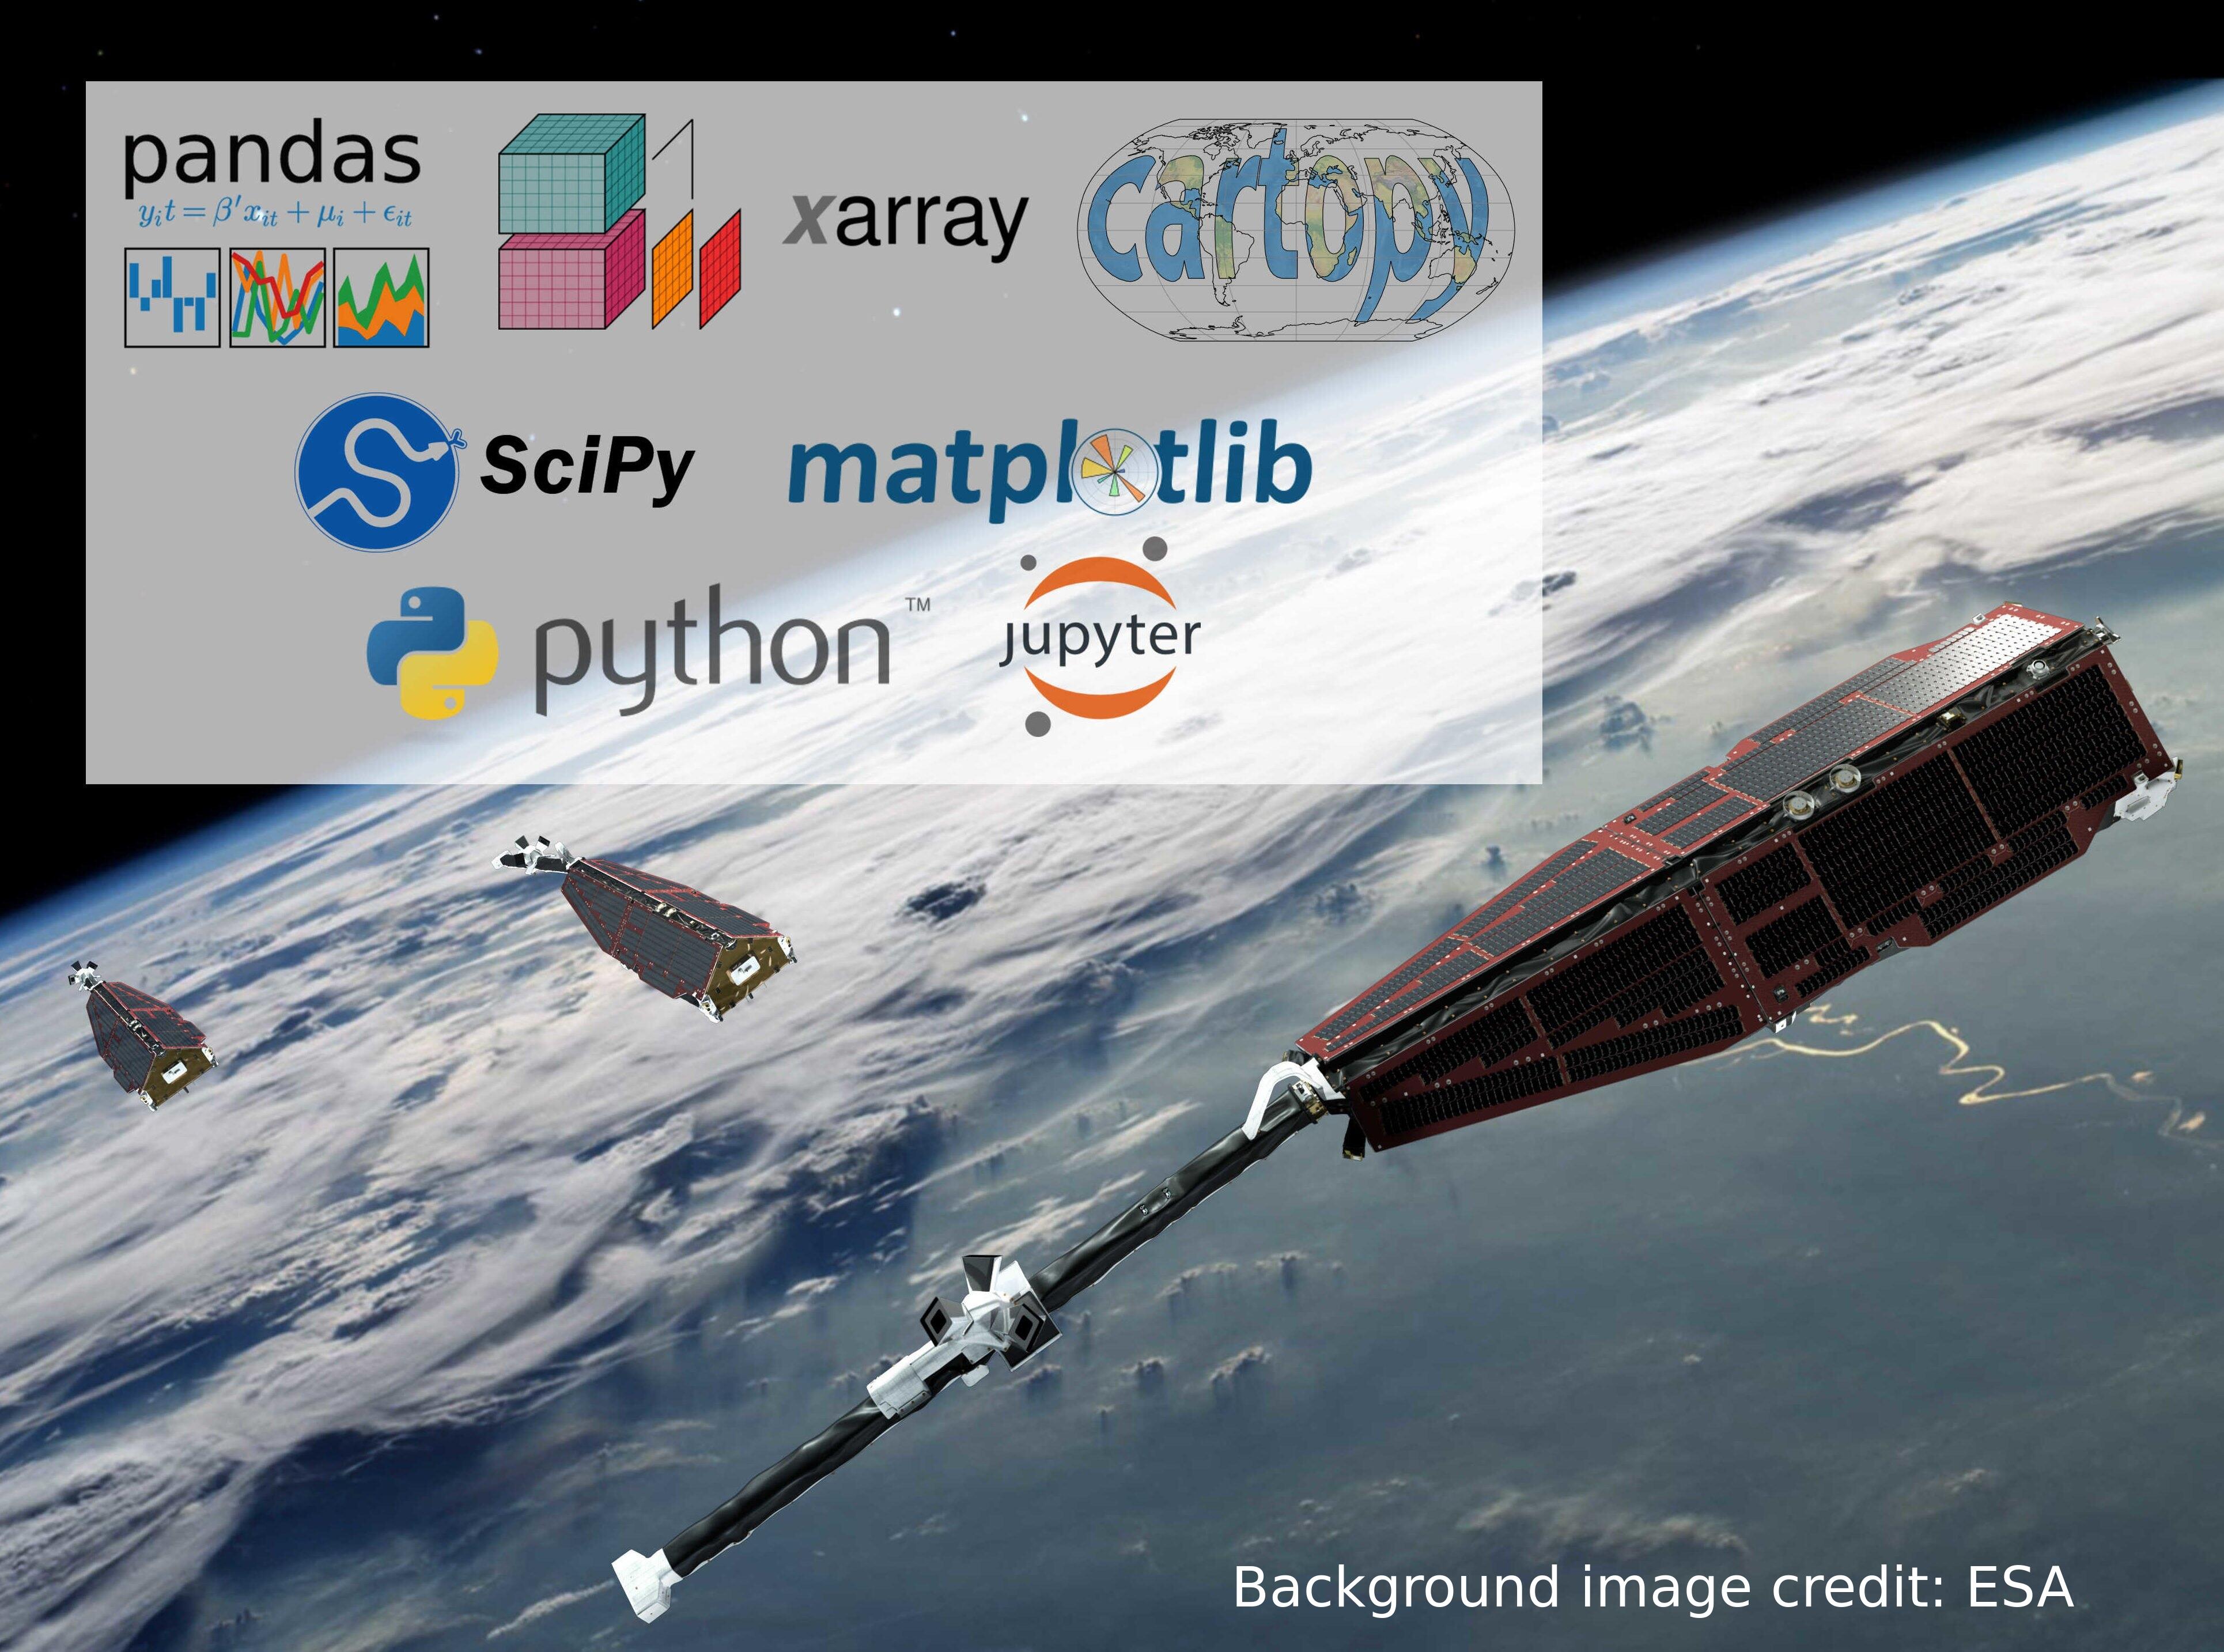
More importantly, viresclient reduces the gap between the mission products and scientific analysis. This is because the user can request just the data they are interested in, and have it delivered in the format they are ready to work with. They don't need to worry about file formats and the time spent data wrangling is reduced. The Python user and developer community provide a wide range of powerful open-source tools which enable scientists to produce sophisticated analyses with minimal effort, with software engineers, data scientists, and physical scientists collaborating to build the tools we need. viresclient handles the request to and download from the VirES server and converts data directly into the Python objects pandas.DataFrame (opens new window), and xarray.Dataset (opens new window) (essentially an extension of pandas to handle higher dimensional data), which are great for organising and manipulating data with a lot of useful built-in functionality. From here, it is easy to directly use tools from SciPy (opens new window) and beyond. For creating map figures, I would like to point out Cartopy (opens new window) in particular.
To learn more about the viresclient interface, please see the documentation (opens new window).
Here are a couple of example figures that can be generated using functionality from xarray and cartopy, using data acquired with viresclient. They show the magnetic disturbance created around the auroral regions (i.e. the poles) during one geomagnetically active day (1st January 2016), explored both spatially and temporally. The code to generate this can be found as a Jupyter notebook here (opens new window).

