VirES for Aeolus - Hunga Tonga Volcano
The VirES for Aeolus (opens new window) service has been created for the purpose of helping the public as well as scientists access and analyze the data from ESA's Aeolus mission. We are happy to see that the capabilities of the service to quickly browse through the mission data are being used to find events captured by the satellite such as the volcanic eruption near Hunga Tonga.
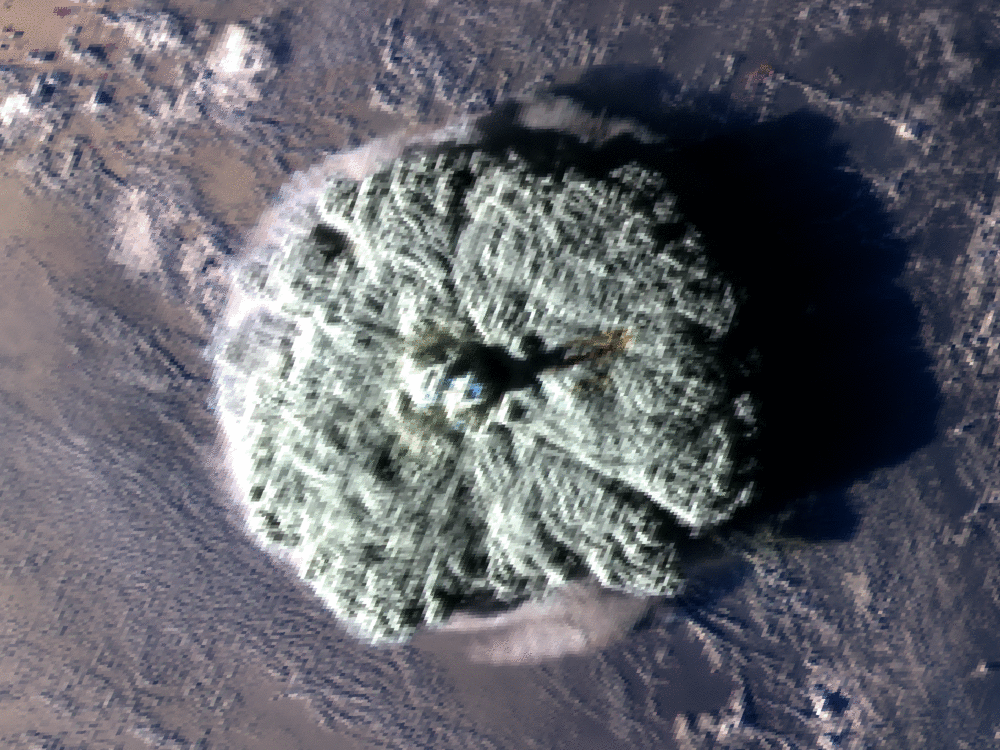
To give some perspective to the magnitude of the event here is an animation created by Petr of the captured eruption as well as a video of the event.
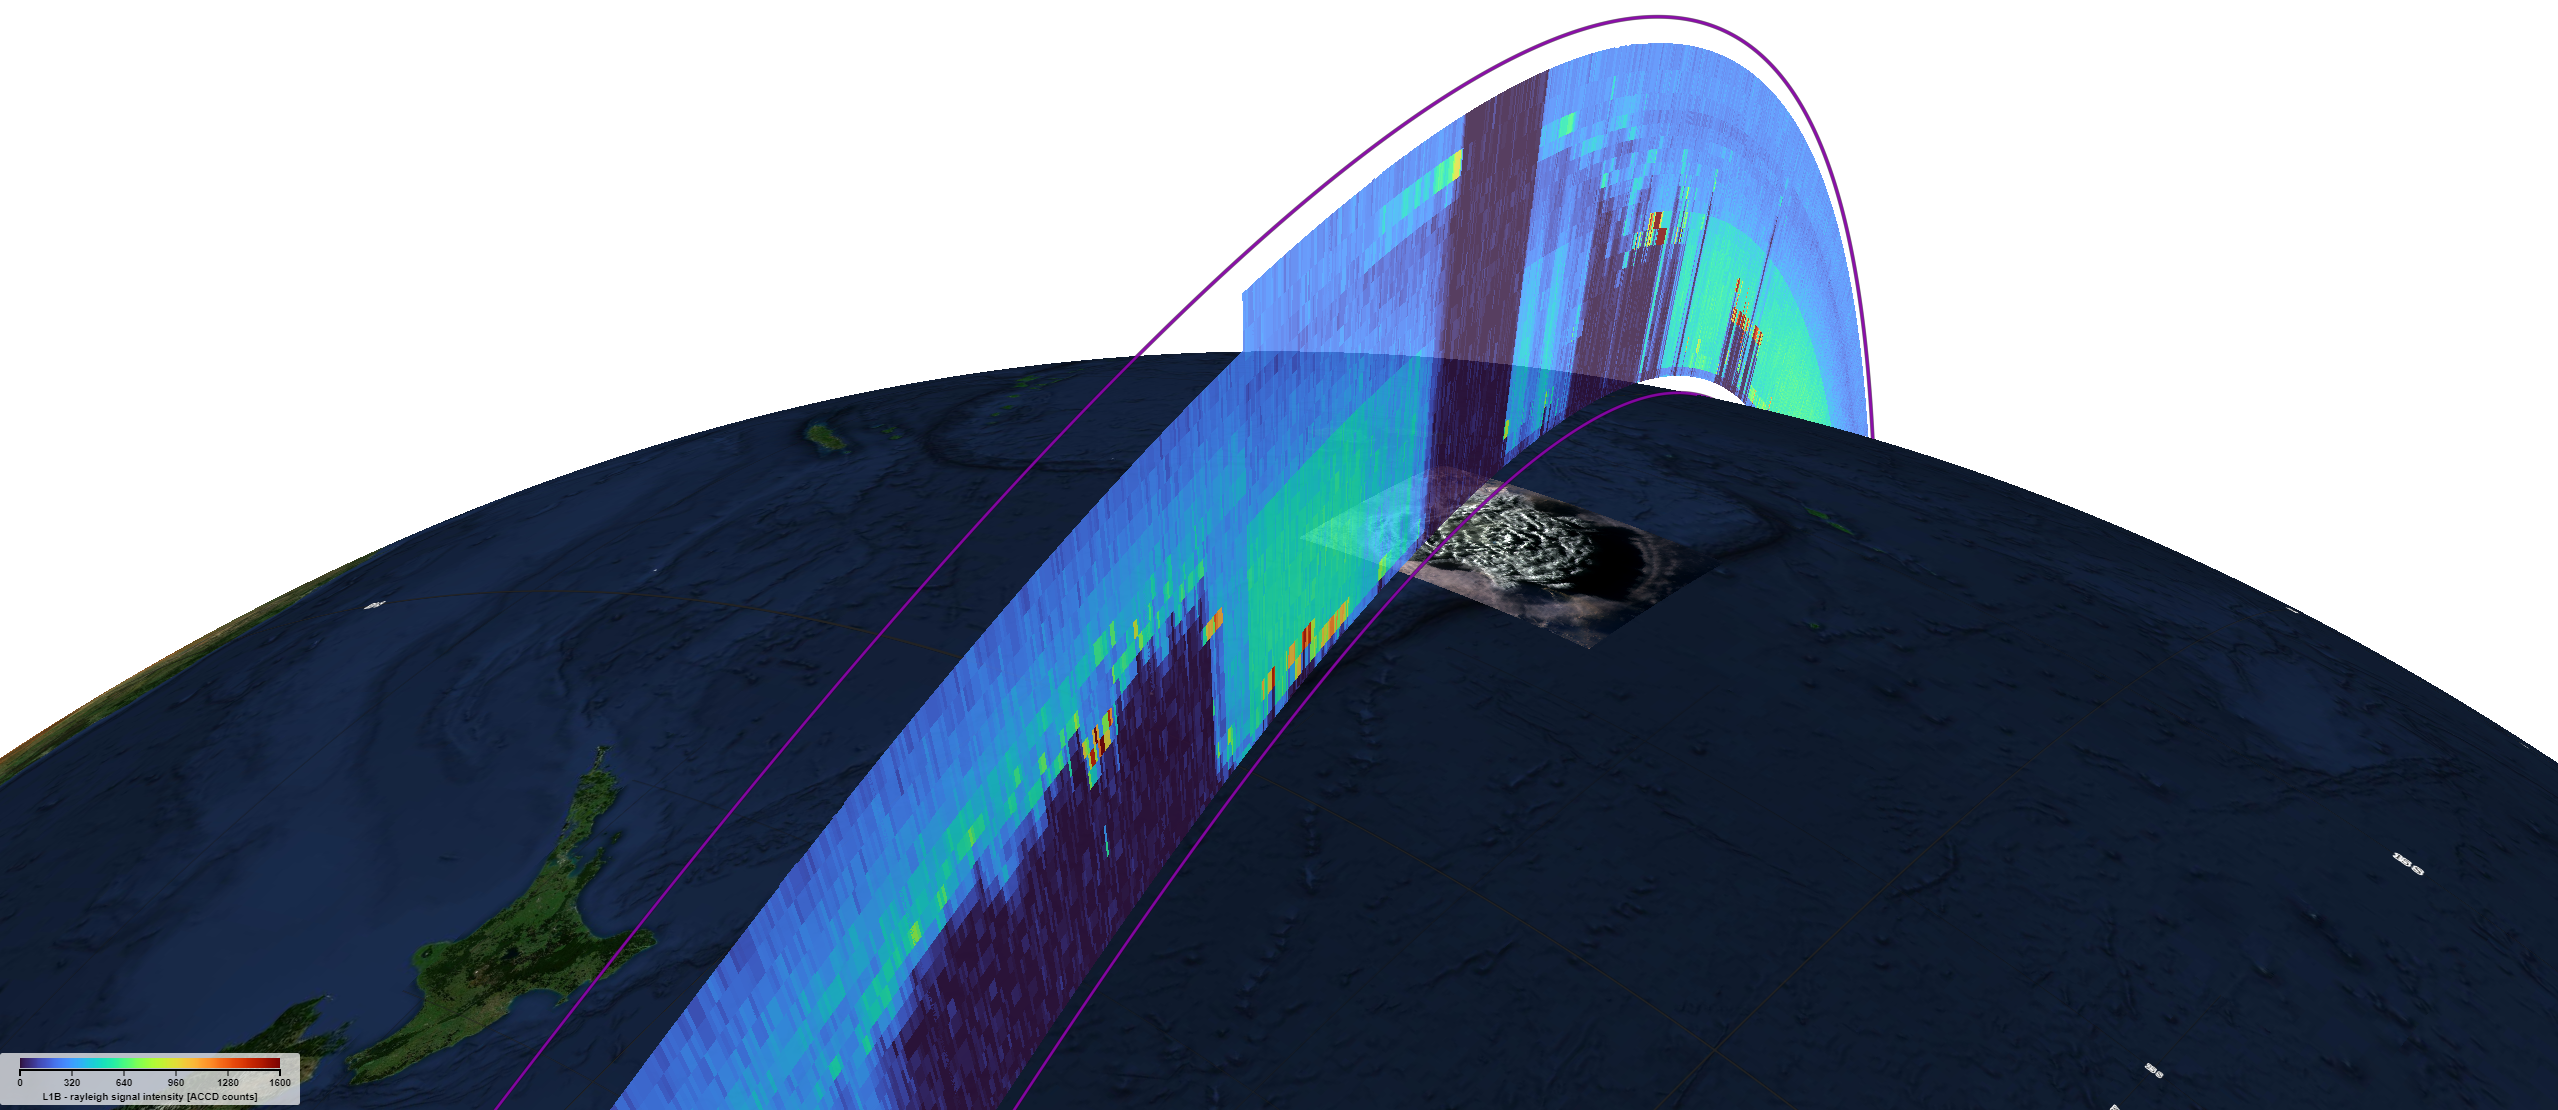
As described in the following tweet by Michael Rennie the Aeolus satellite shows a massive attenuation of lidar signal downwind of the Tonga eruption. This illustrates that the ash plume must be higher than 20.5 km, which is the maximum measurement altitude of Aeolus in this area.
Please allow cookies and disable adblock to load this Tweet.
You can change your cookie settings at a later point in time
here.
A great article describing the use of satellites to understand this event was posted by the BBC news (opens new window).
We are currently working on extending the VirES for Aeolus functionality to allow even deeper and direct manipulation of the Aeolus data by providing a Virtual Research Environment (VRE). We are in the final steps of preparation and hope to make this extension soon available to everyone. To help in this activity, as well as to support during the design phase a scientific partner team has been established with LMU¹ and DLR².
Alexander Geiss (LMU) has used the VRE to analyze the data and create some plots. He was kind enough to provide some scientific background further below.
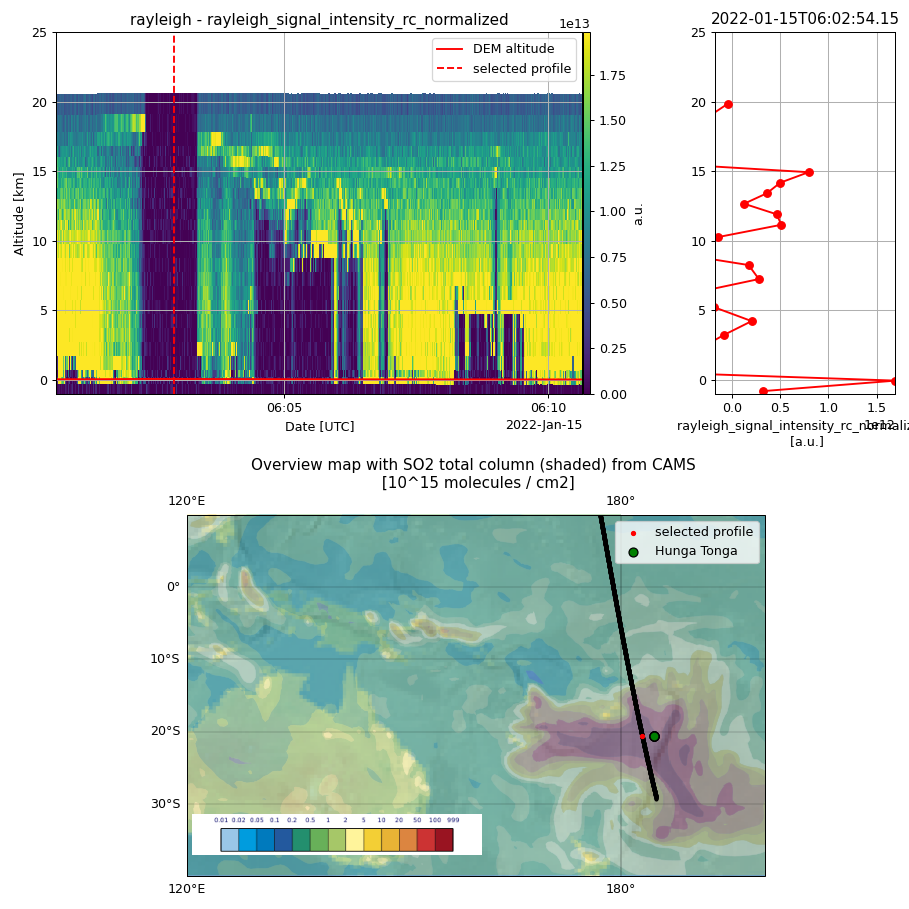
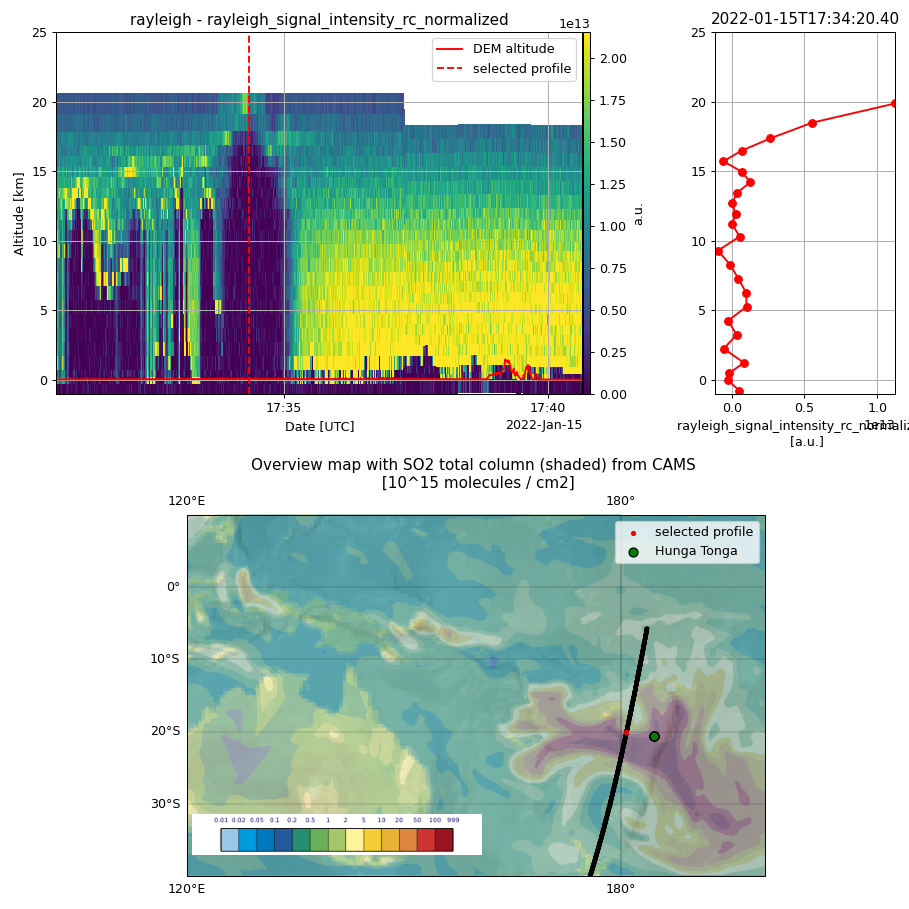
Figure 1 and 2 are showing the time-height cross sections of the range-corrected attenuated backscatter signal of the lidar onboard the Aeolus satellite (top left) as well as a single profile (top right) and an overview map of the corresponding satellite overpass (bottom). Light emitted by the laser is scattered and absorbed by molecules and particles when travelling through the atmosphere. The telescope only receives the backscattered light.
Clouds are visible as yellow patches (high backscatter signal) on the time-height cross section preventing the laser to penetrate further down or causing a high attenuation of the signal below (dark blue stripes). But also aerosol plumes can cause strong attenuation of the backscattered laser light if they are optically thick enough. This can be seen in Figure 1 which shows measurements right after the volcanic eruption which took place around 04:20 UTC. Since Aeolus' variable maximum measurement range is set to 20.5 km for this geographic region, only a "dark" stripe representing a strong or fully attenuated backscatter signal is visible which must be caused by a dense particle layer above. This illustrates that ash must have been thrown above these 20.5 km altitude. In addtion, the overview map shows the total column of sulphur dioxide from the CAMS model which is realeased by volcanic eruptions and can be used as an indicator of the location of the plume.
We see a great potential to help scientific activities with the VRE and are happy to soon be ready to make it available to everyone!
¹ Ludwig-Maximilians-Universität München
² German Aerospace Center