How EO expertise powers agri-monitoring decisions (Part 1)
This blogpost is the first part of a multi-post series.
# Introduction
The European common agriculture and rural development policy is ambitious to implement a performance based and compliance-driven delivery model of area based payments. Strong emphasis is put on the use of earth observation (EO) and of recently available new technologies, such as big data-GIS, IoT solutions, cloud services or artificial intelligence. Such new EO-data analysis technological approaches had increased the meaning and use of open value chains, data sharing, and multi annual monitoring. The fundamental paradigm shifts of checks by monitoring - meaning the control on agricultural parcel level the area based payments - and of Area Monitoring System (AMS) has been recently codified in EU regulations. AMS is defined as a “regular and systematic observation, tracking and assessment of agricultural activities and practices” by satellite data, primarily Copernicus Sentinels. Thus, it is now clear that Paying Agencies and the agricultural administration is facing the challenge not only as a technological step forward, but this paradigm shift will enforce redesigning some fundamental elements of the existing robust Integrated Administration and Control Systems (IACS), while continuously functioning should still be ensured.
The EO-WIDGET project aimed at developing a robust technological chain linking EO data processed in cloud environments to a web interface that delivers the data and the result towards the end-users. Agri service platform integrates mini-applications providing visualization access to monitoring products and related quality assessments, while at the same time supporting expert judgment, and user activities in GIS environment. One of the key point is that the end-user platform presents real-time processed EO signals, while the back end processing can be distributed among several cloud locations and processing chains.
The Agri service platform is designed with full interoperability in mind, allowing
- to consume data products upstream from service providers of choice and
- to serve downstream APIs consumed by WebGUI applications like the AgriApp or by data-exchange logic to integrate with the PAs environment. Monitoring products from multiple sources can be sustained in the platform and analysed there for conformance and quality.
A monitoring product is the combination of EO-signals, vegetation status indexes, spatial indicators and markers derived for predefined group of declared parcels. The applied decision parameters are combined along the rules defined by the Paying Agencies. The app is also willing to serve to “look behind the algorithm”, while it can become the user interface of fine tuning or setting the acceptance limits of an automatized image processing.
# Parcel Explorer
# Main Interface
On the initial application visit, the user is greeted with a dashboard-like interface consisting of multiple interactive elements: Welcome to the Parcel Explorer! The Parcel Explorer is the main tool for visually inspecting compliance (or non-compliance) of various parameters and markers in the scope of CbM.
Current supported use cases are Cultivated Crop Type (Crop Type Conformance and Declared Groups), Grassland Mowing (Mowing Events and Mowing Events Conformance), Harvest (Harvest Detection Conformance) and Winter Catch Crops (Winter Catch Crops Conformance). Each of these use cases can be defined and configured individually in terms of dashboard layout - map and chart elements, color schemes, visualized data, classification/categorisation of the data (etc) -, to fulfil the needs of the application, data availability and user screen resolution. The basic unit of evaluation is the agricultural parcel and the incomming vector and raster databases are processed and published on-the-fly via cloud environments. For further technological details see Part 2.
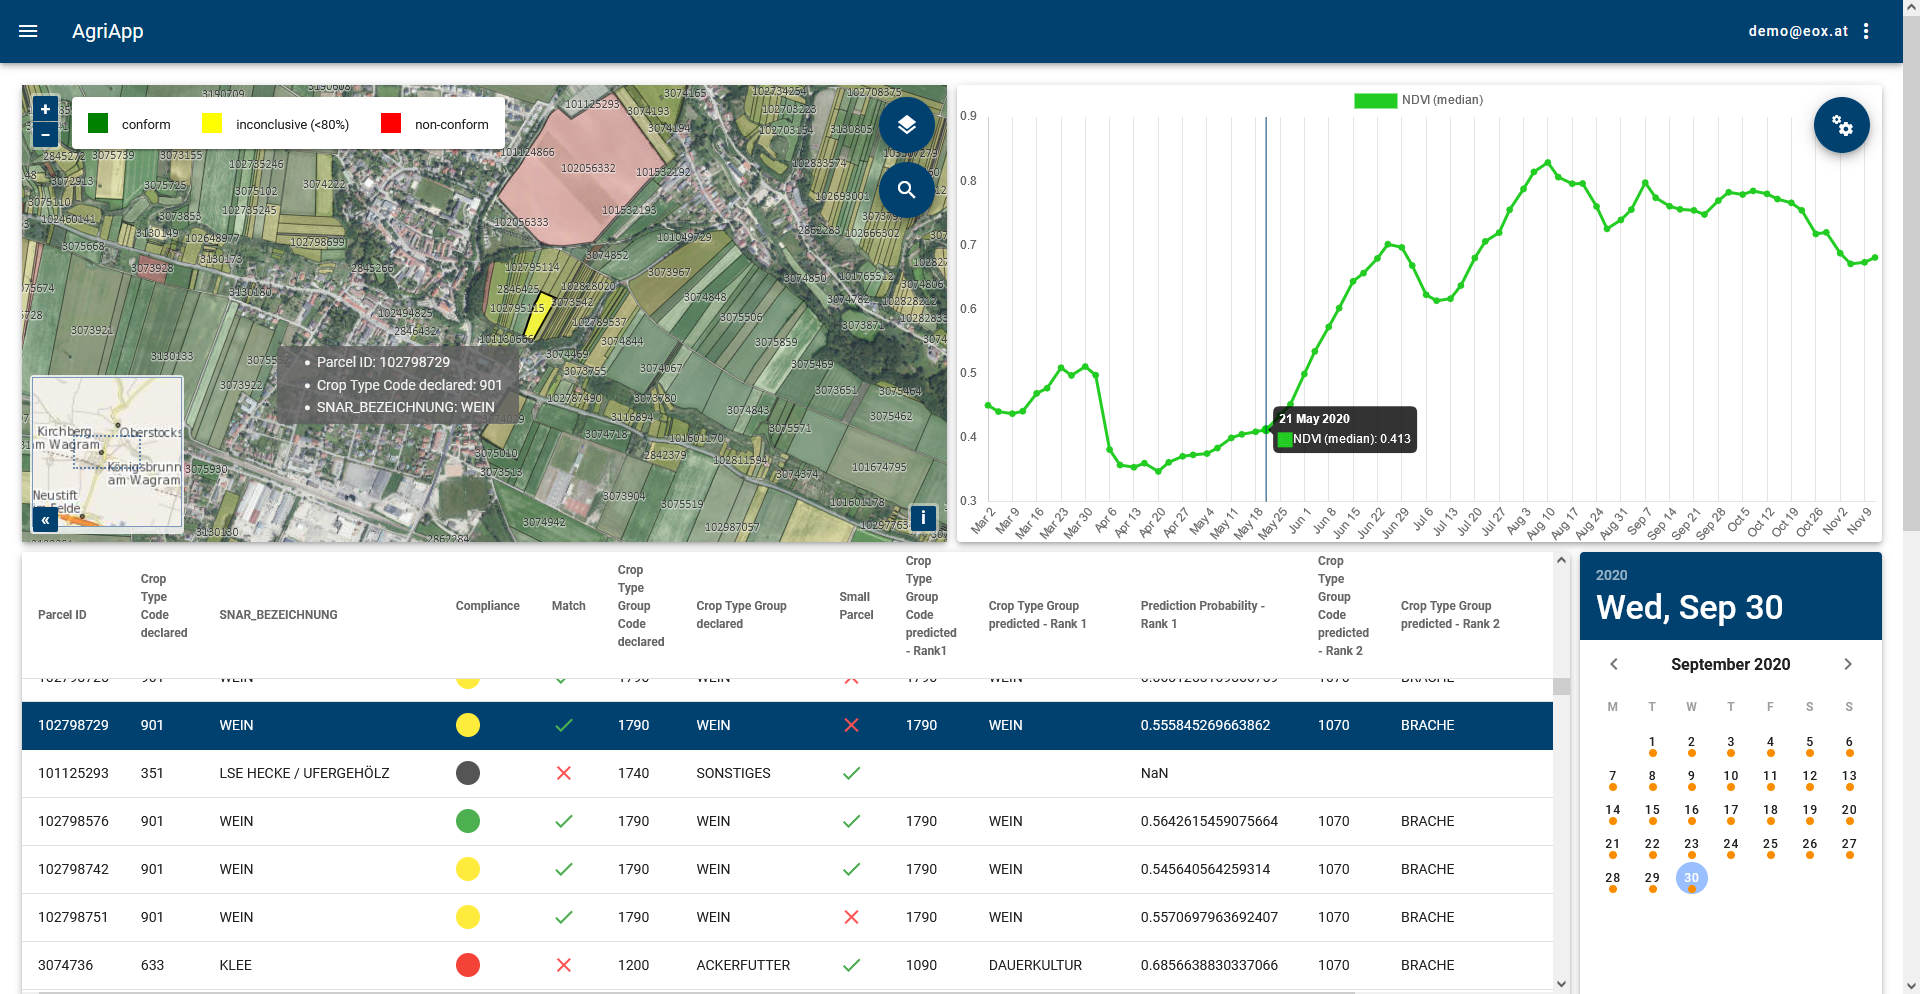
# Parcel Map
The heart of the Parcel Explorer is the map element, which allows the user to browse and visually inspect agricultural parcel data, glimpse into parcel metadata (mouseover on a single parcel), switch between data product visualizations (e.g. Crop Type Conformance and Declared Groups), show/hide map layers, and draw reference areas (enabling a comparison of statistical parameters of a selected parcel and the average value of the same crop in its user defined surroundings and further similar functionalities). An overview map helps to analyse the bigger picture.
# Parcel Table
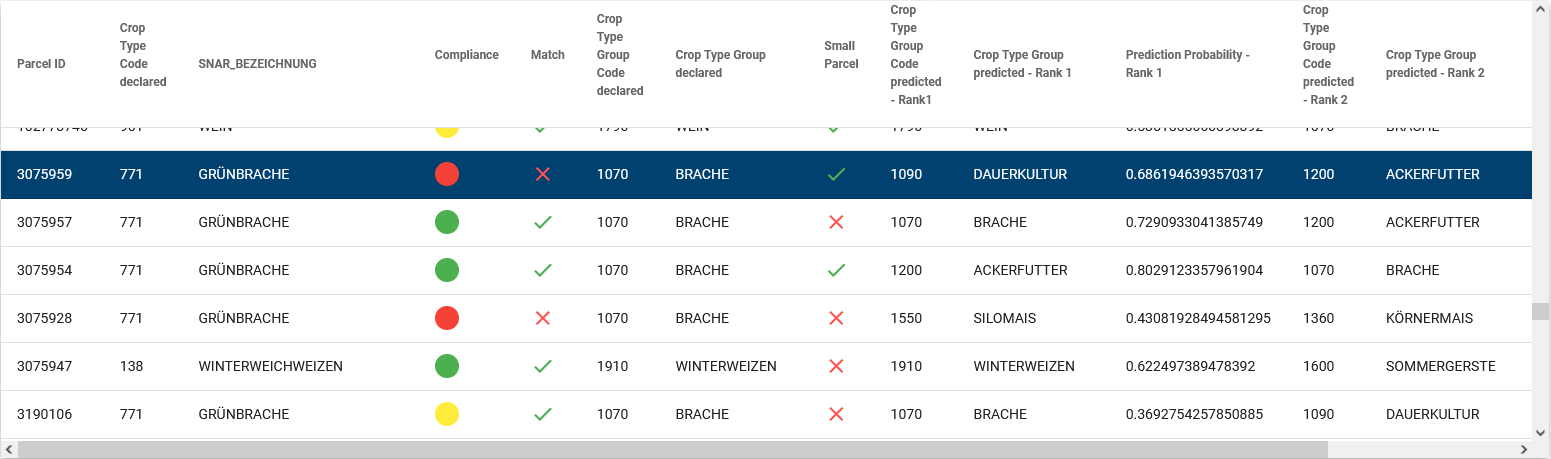
As an alternative to the map element, the user is also able to use the table element to see the very same parcel shown on the map, plus all the related declaration and control result data actually listed. The selection, highlighting and filtering between table, map and all other elements are synchronized, meaning no matter the user selects a parcel, the other elements update as well. These functions had been designed to support the user interaction of analyzing, understanding and evaluating the result of automatic satellite signal processes. Multiple filtering of parcels based on the listed attributes also supports data analysis.
# Parcel Chart
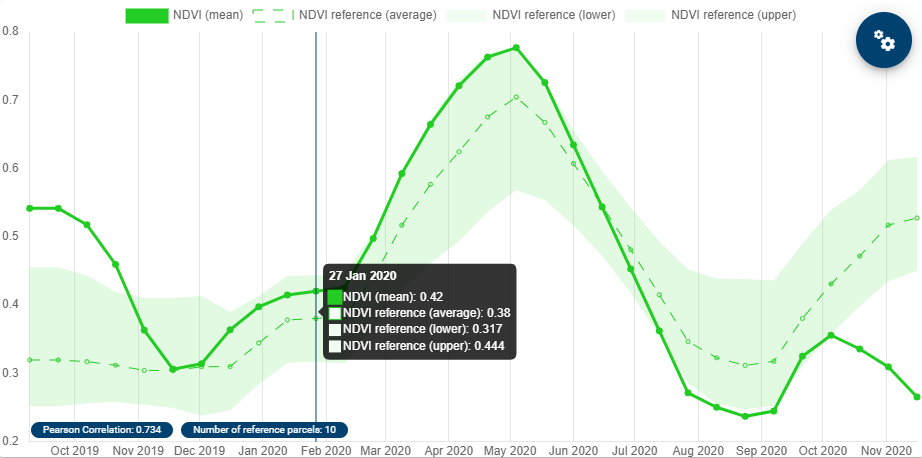
The chart element offers insights into the changing of EO signals or markers over time. Individual datasets (NDVI, coherence and more) can be shown / hidden, and the reference signals can also be visualized. Time limitations and compliancy/non-compliancy windows of markers can also be visualized on the chart. Selecting a data point in the chart also sets the date for the whole Parcel Explorer interface, synchronizing the date picker and image grid (described below) with the currently selected date.
# Parcel Image + Image Grid
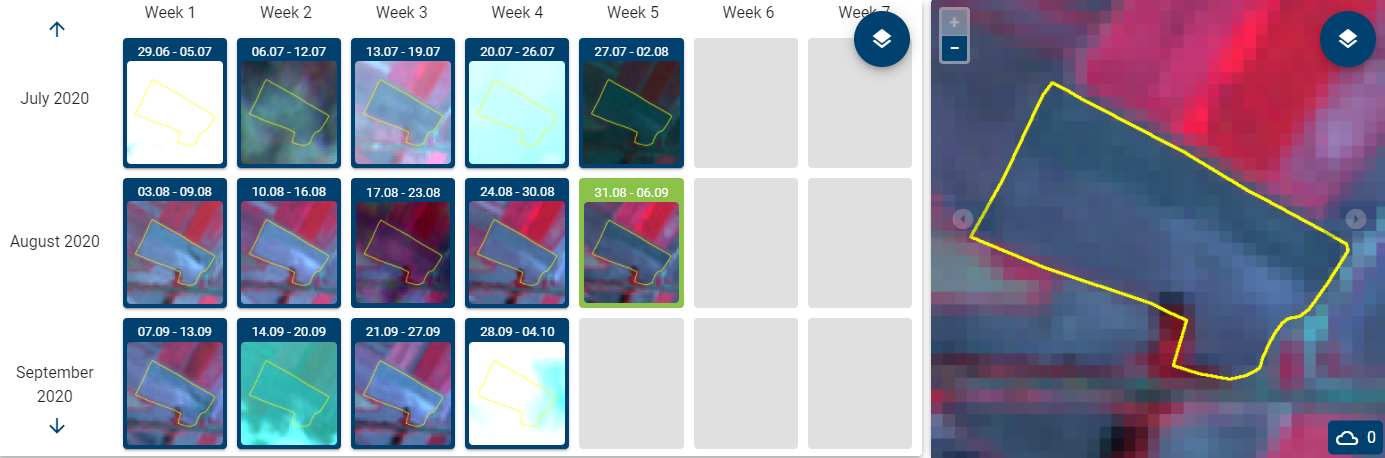
The image grid and single image view are tools that enable a direct look at the satellite data used for product generation. The user can display an overview of imagery for a selected parcel with weekly or daily granularity, and can browse through the selected parcel on individual images one by one. Visualization of the images and processed EO-signals might vary and can be switched by the user: pre-defined color composites; continuous and classified scaling of spectral indexes or cluster maps or also cloud cover information.
# Quality Assessment Tool
Besides the parcel explorer, the application also includes some data-science-driven app views. These provide an overview over all algorithm results that are applicable for each use-case. Where prepared by the paying agency, also compliance rules for the whole territory are evaluated.
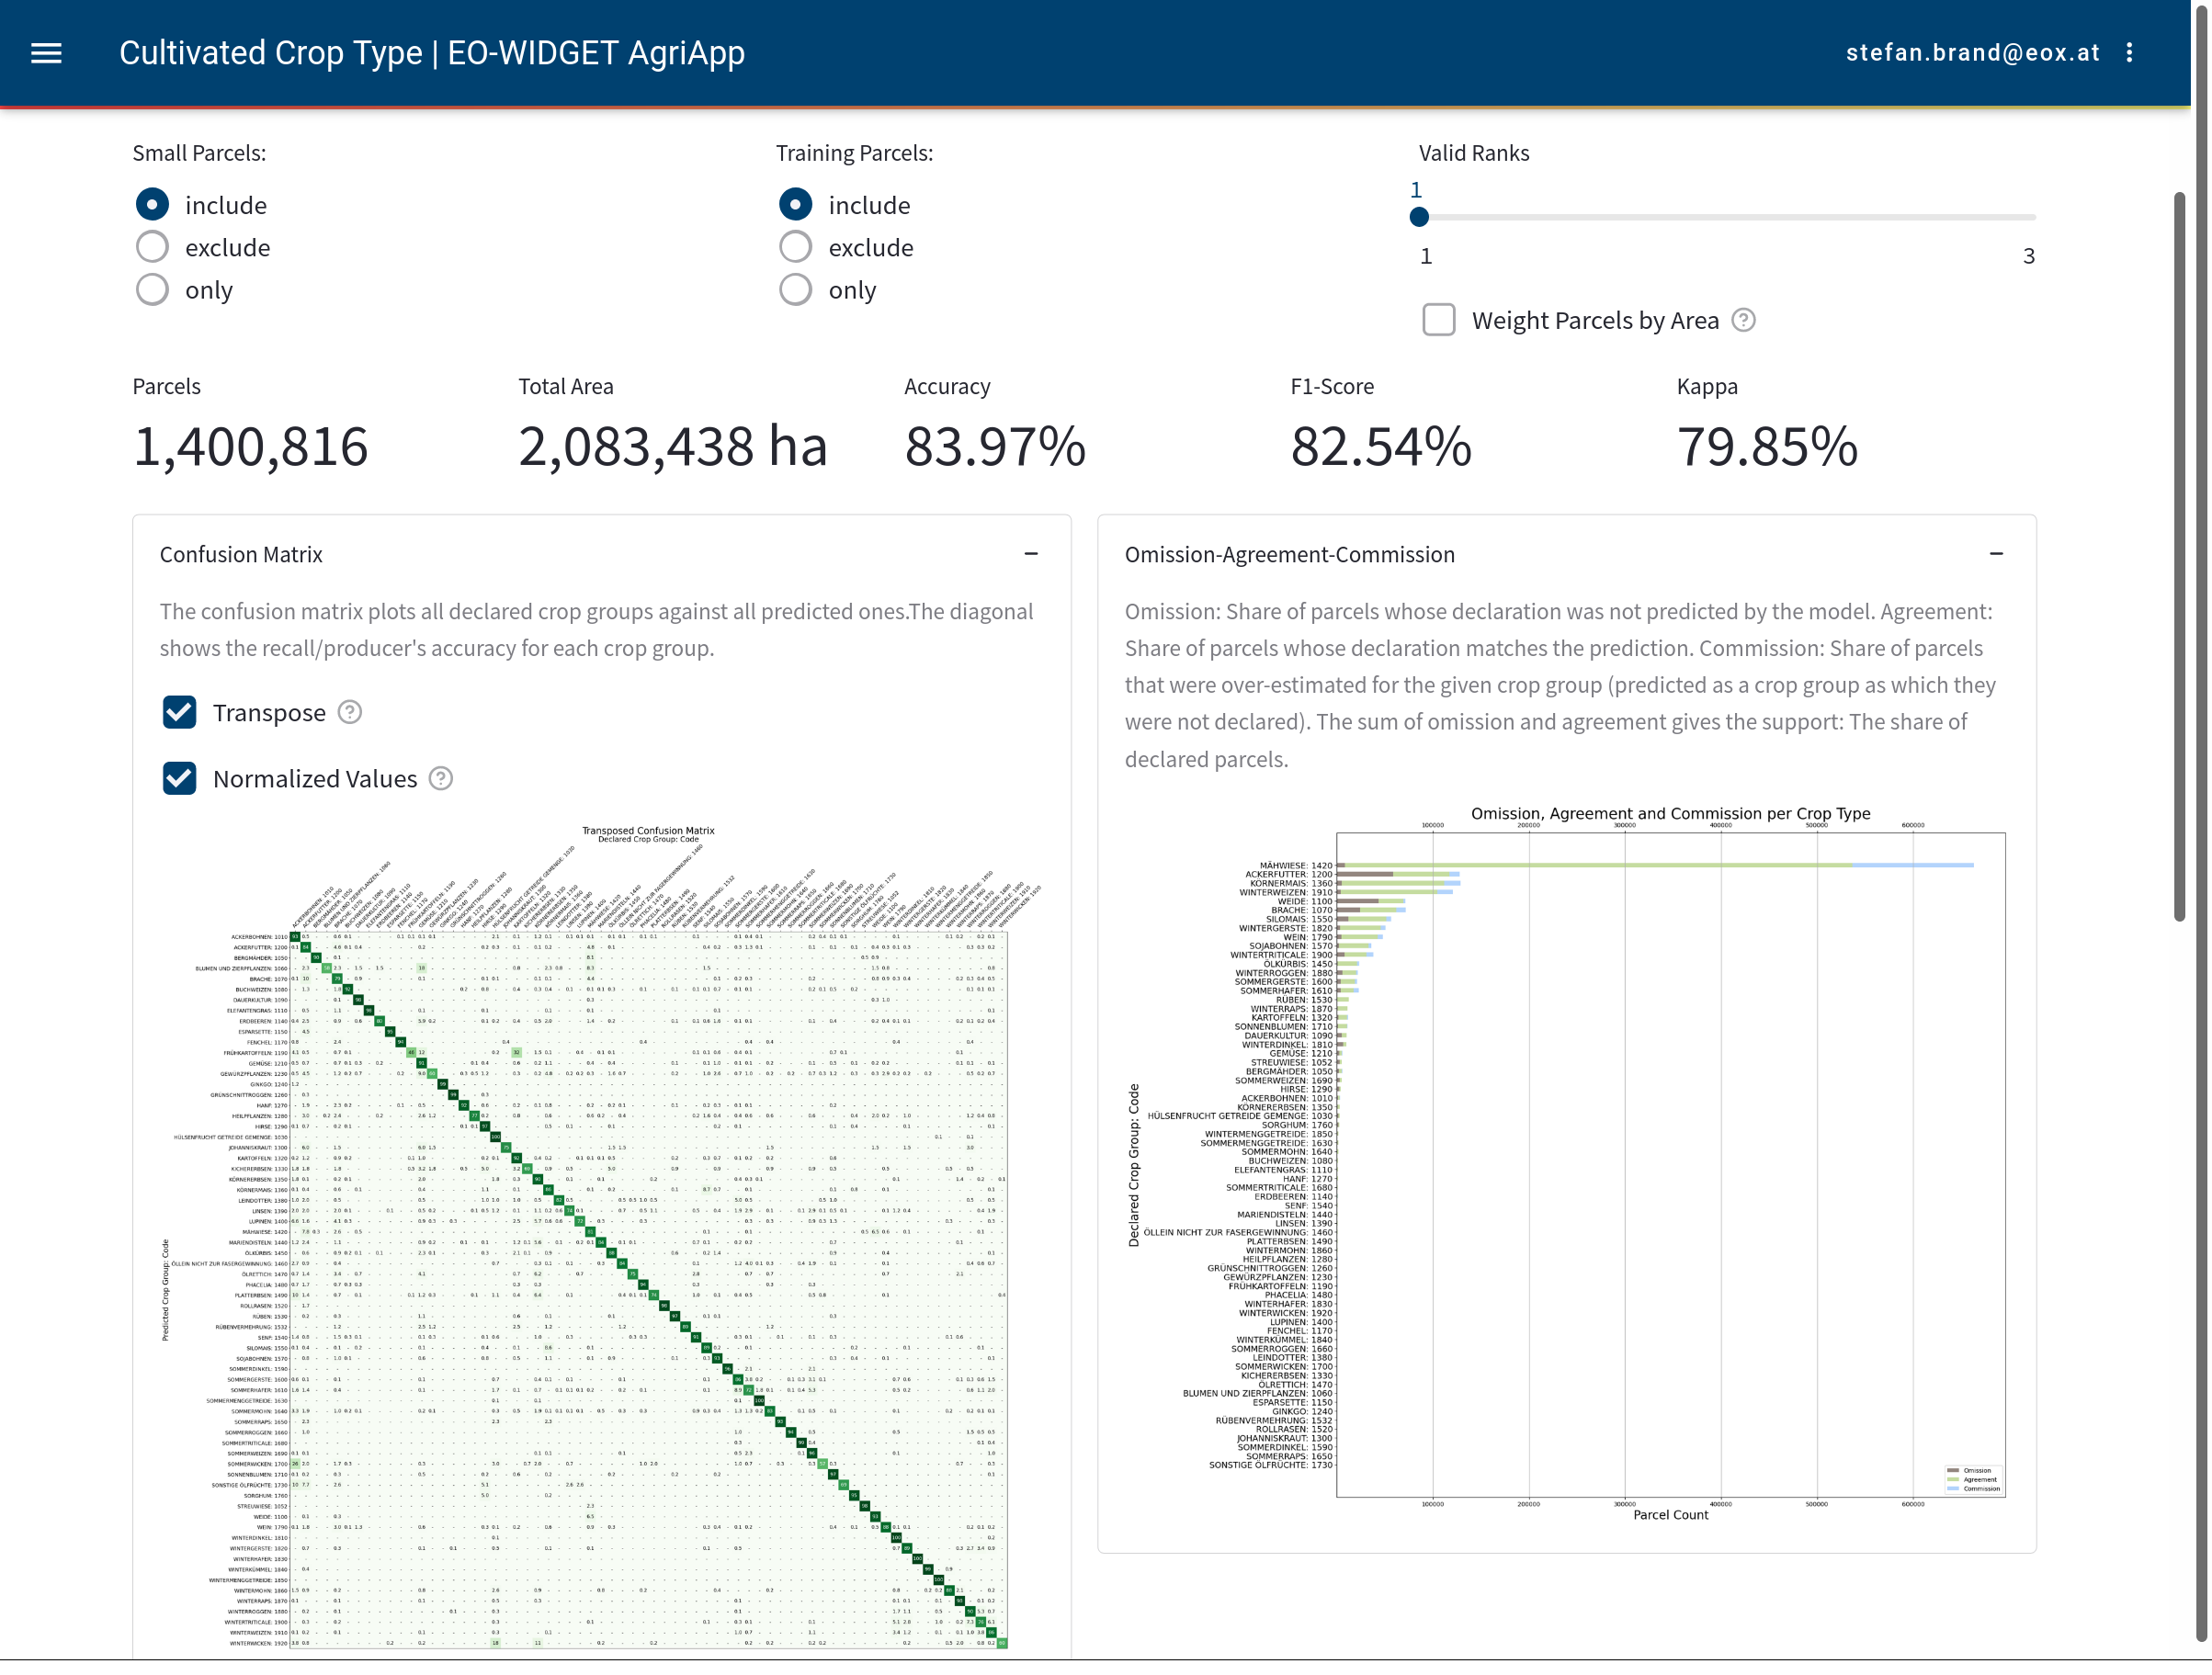
In the context of crop type classification a confusion matrix, an omission/commission chart and an f1-score chart is displayed. All of these are configurable inside the app. Settings like the exclusion of small parcels and training parcels, and if the results are weighted by parcel area, are defined by the user.
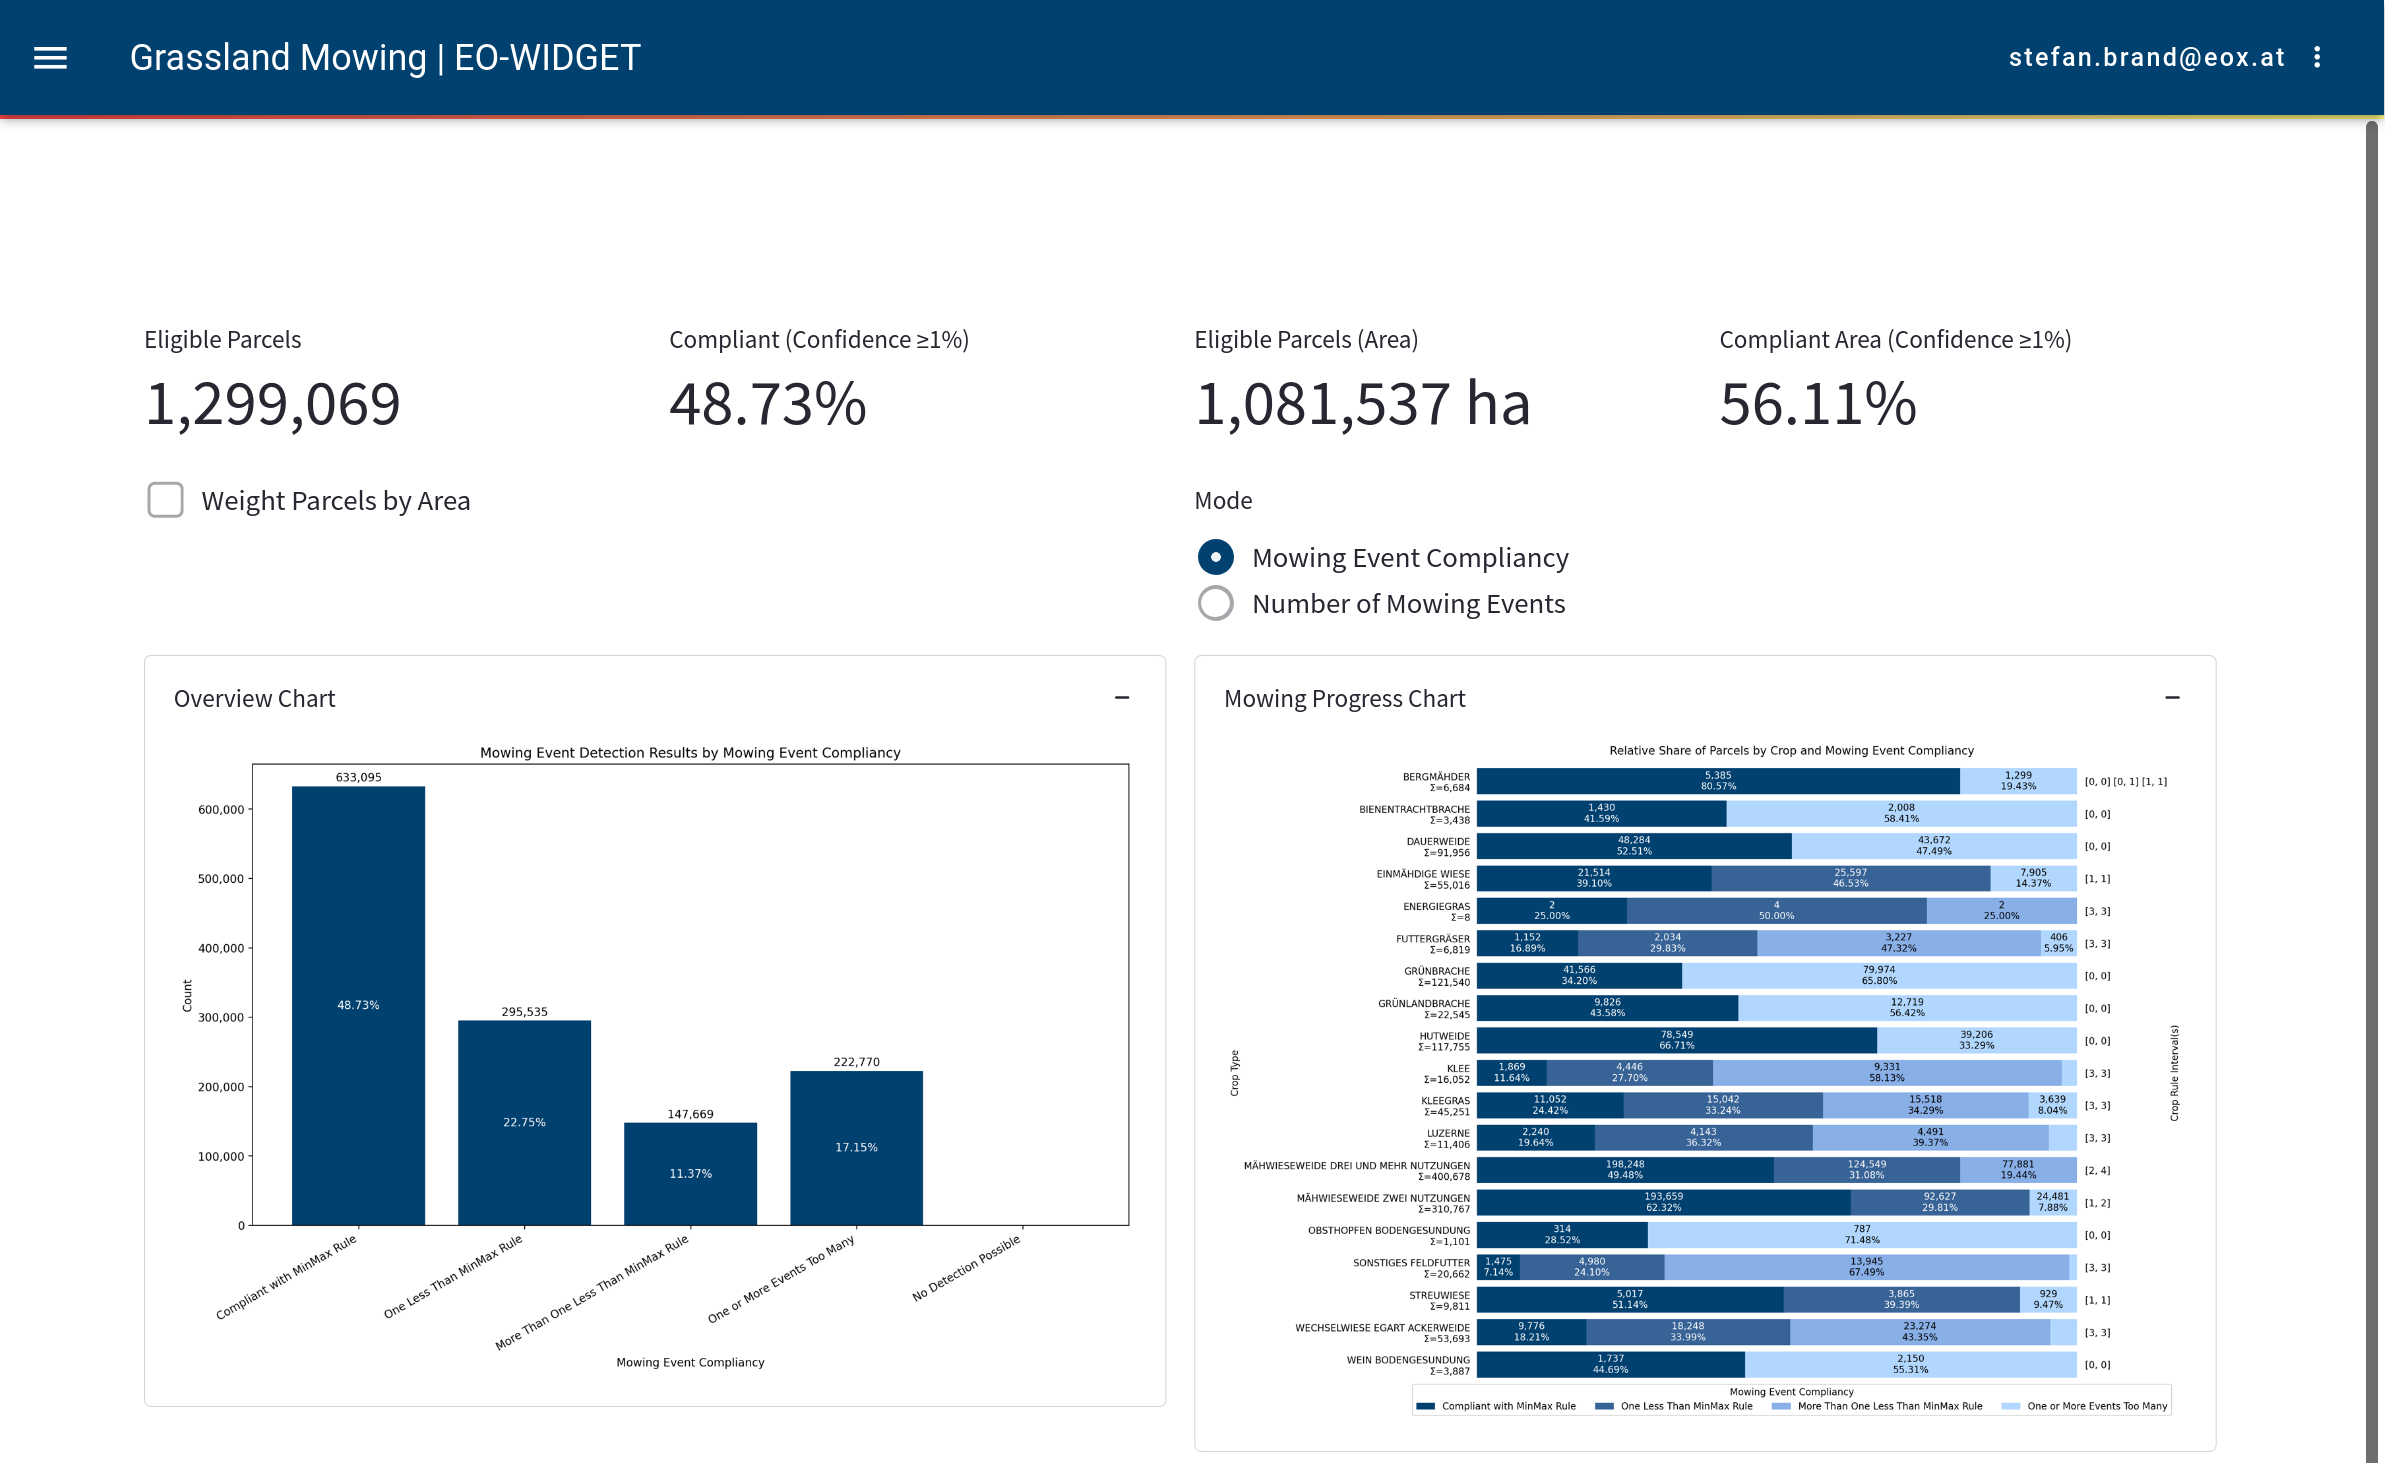
Also available is an interactive report for the grassland mowing use-case. Two charts are available, each in two different modes. The chart types are an overview bar chart and a mowing progress chart by crop type. Inside the app the user can switch between a view for the number of mowing events or a view for mowing event compliance values.
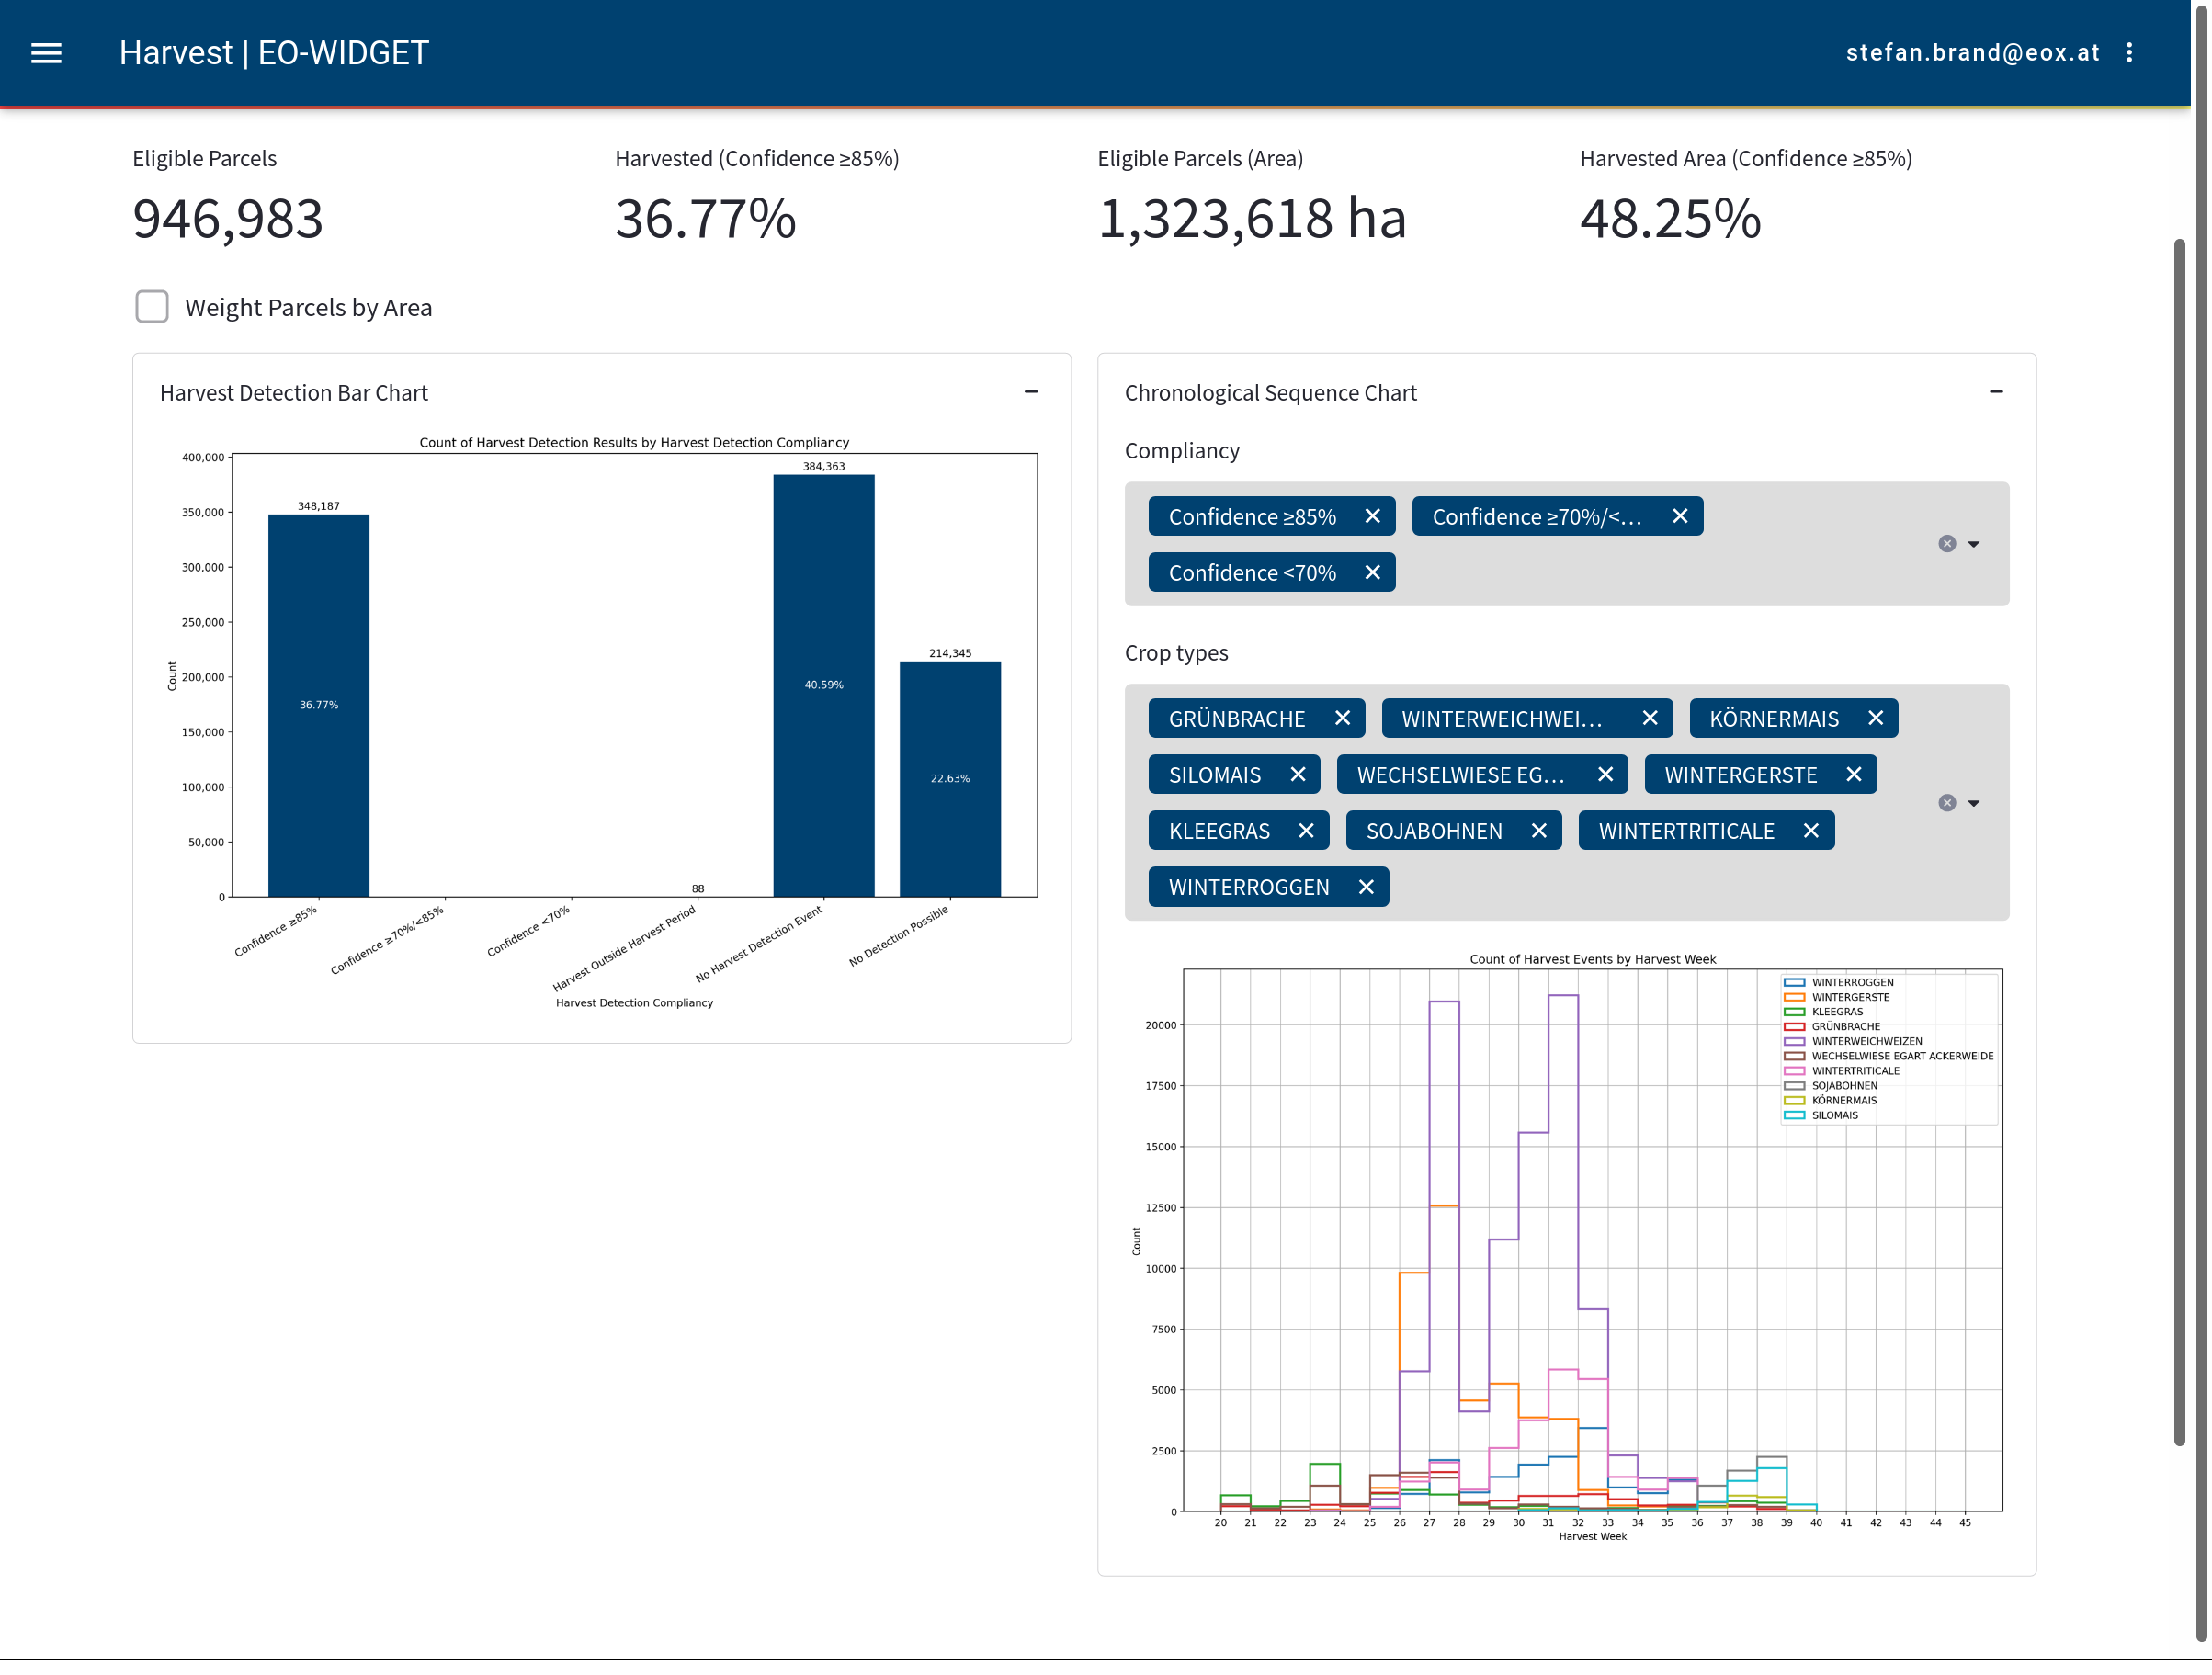
The harvest use-case also features two charts. One of them is an overview bar chart similar to the one in the grassland mowing report. The other one is a chronological sequence chart that displays the harvest events by crop type and calendar week. The harvest events can be filtered by confidence values (e.g. all harvest events with a confidence greater than 85%).
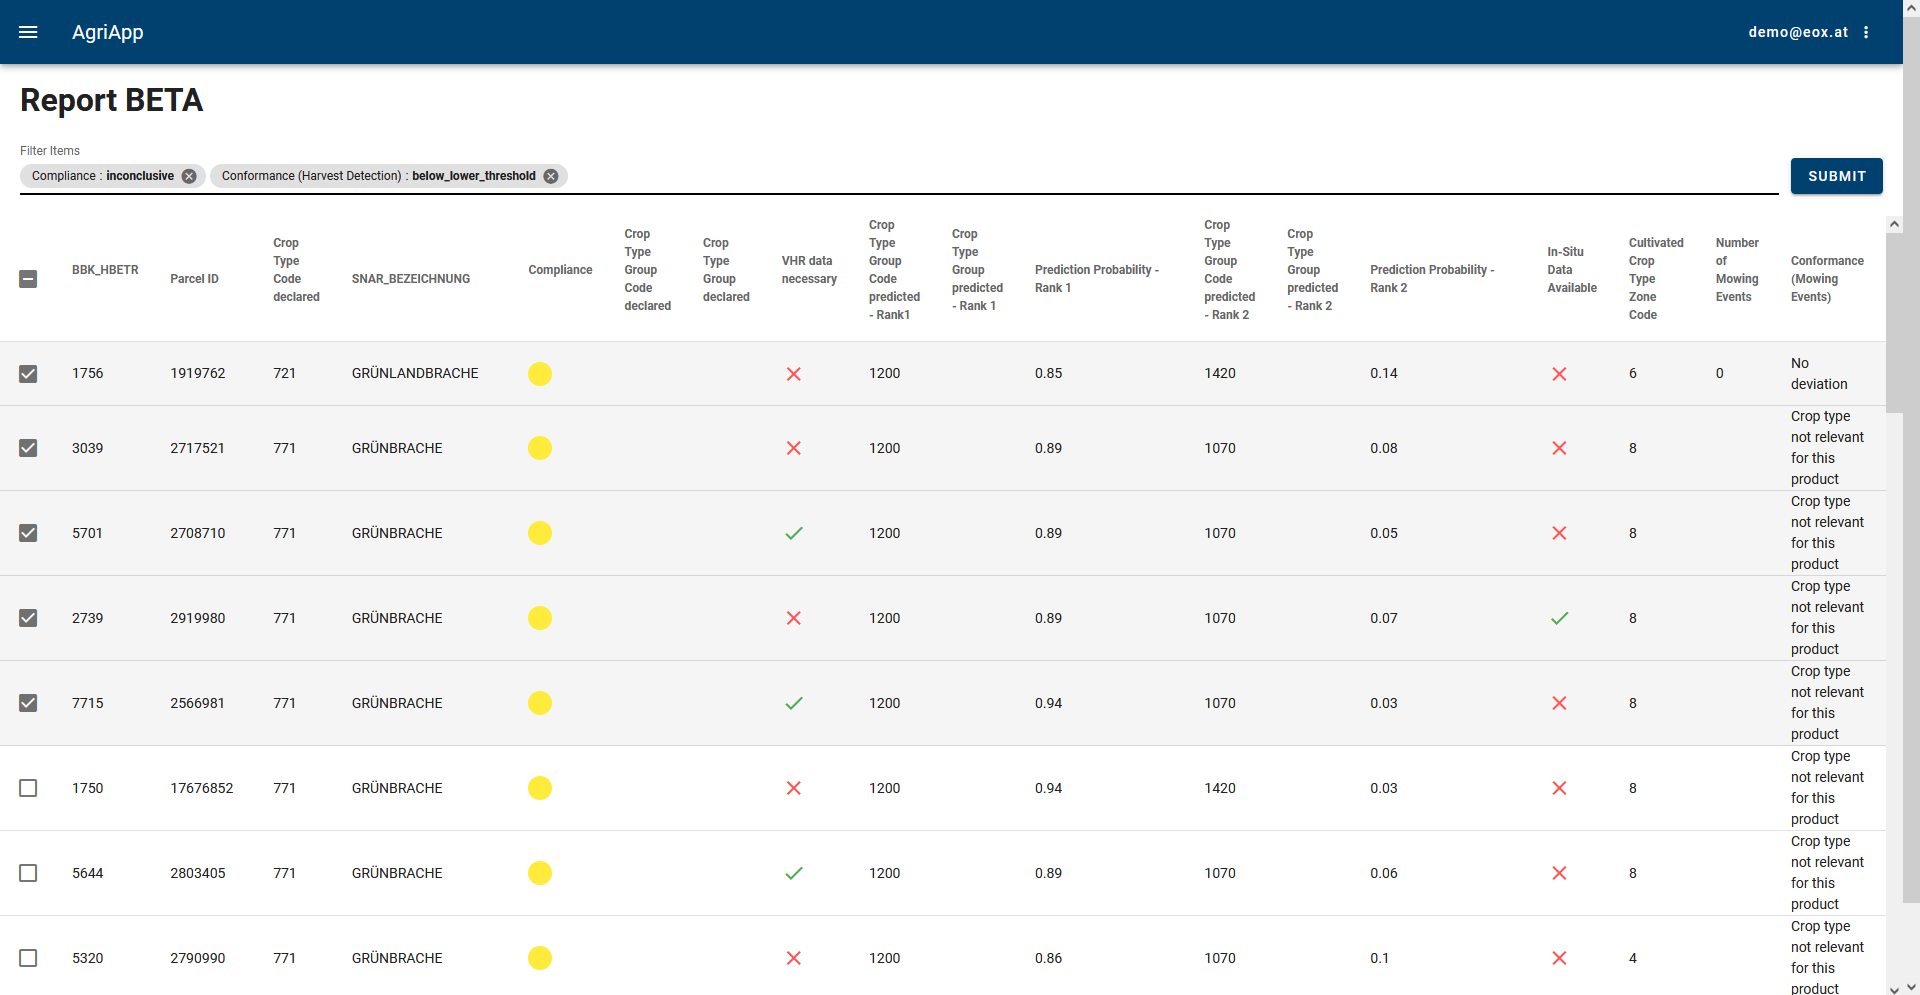
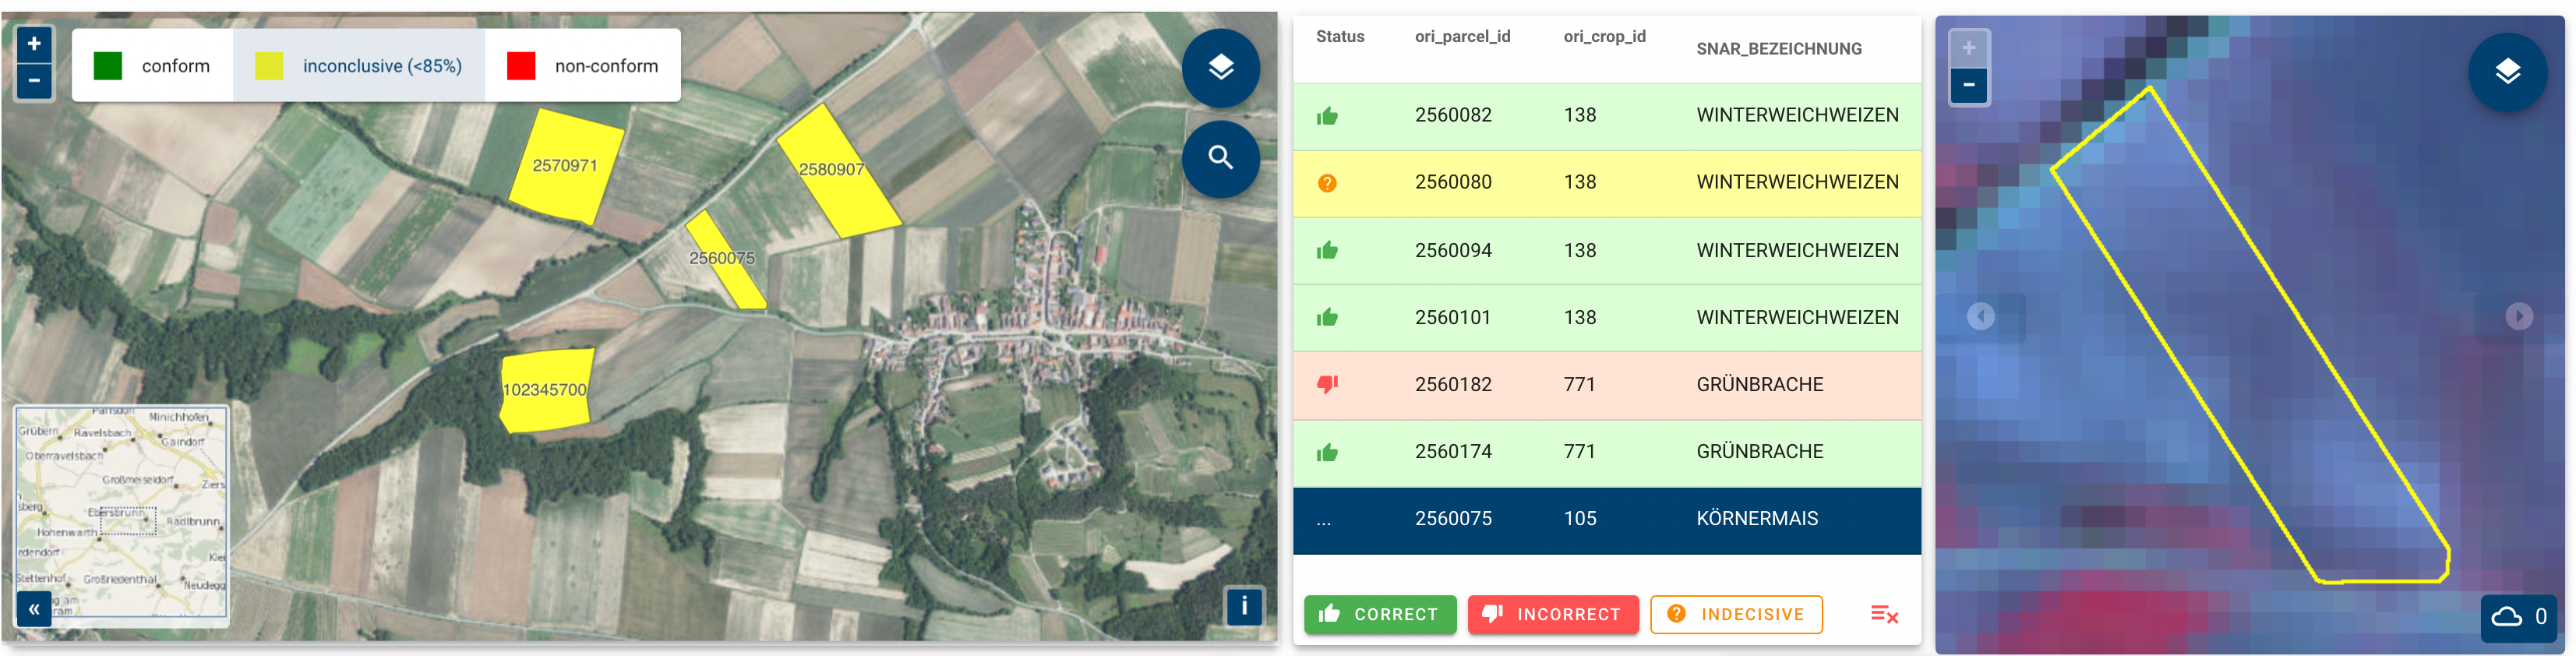
# Expert Judgement & ToDo Workflow
In the Reporting View, the user can search and filter the entirety of the parcel database and find parcels of interest for the current task. It is then possible to export group of parcels to analyse further in other parts of the application. For example, it is possible to filter parcels also by any quality description value, practically to list parcels contributes to an element of the confusion matrix.
In the ToDo element, the user can click through the previously selected parcels one by one to do photo interpretation (CAPI) in relation to markers and compliance decisison. Each parcel can have several status assigned storing the metainformation of the expert validation.
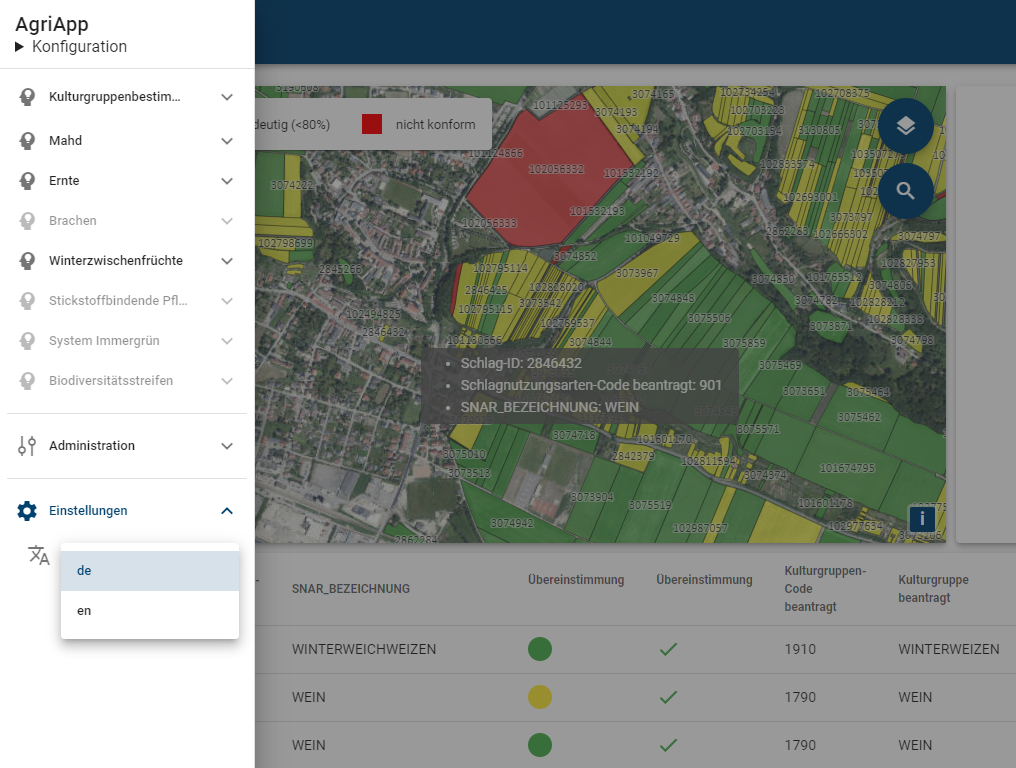
# Internationalization
As the aim is to make the AgriApp accessible to a wide professional audience from several member states, a continuous translation has been integrated into the workflow. If interested, paying agency employees can even review and improve translations on their own. Translation efforts even go so far as to provide database columns in local language. Since the AgriApp is data source agnostic, it does not know about the database columns upfront. Via a translations endpoint it is guaranteed that even those database columns are understood by everyone.

# Agri Blogpost Series
This blogpost is part of a multi-post series. In the next blogpost, the services and APIs powering the AgriApp will be covered, plus a description on how to get on board and reap benefits for your workflow!