EOxCloudless Sentinel-1 and Sentinel-2 Analysis Ready Data
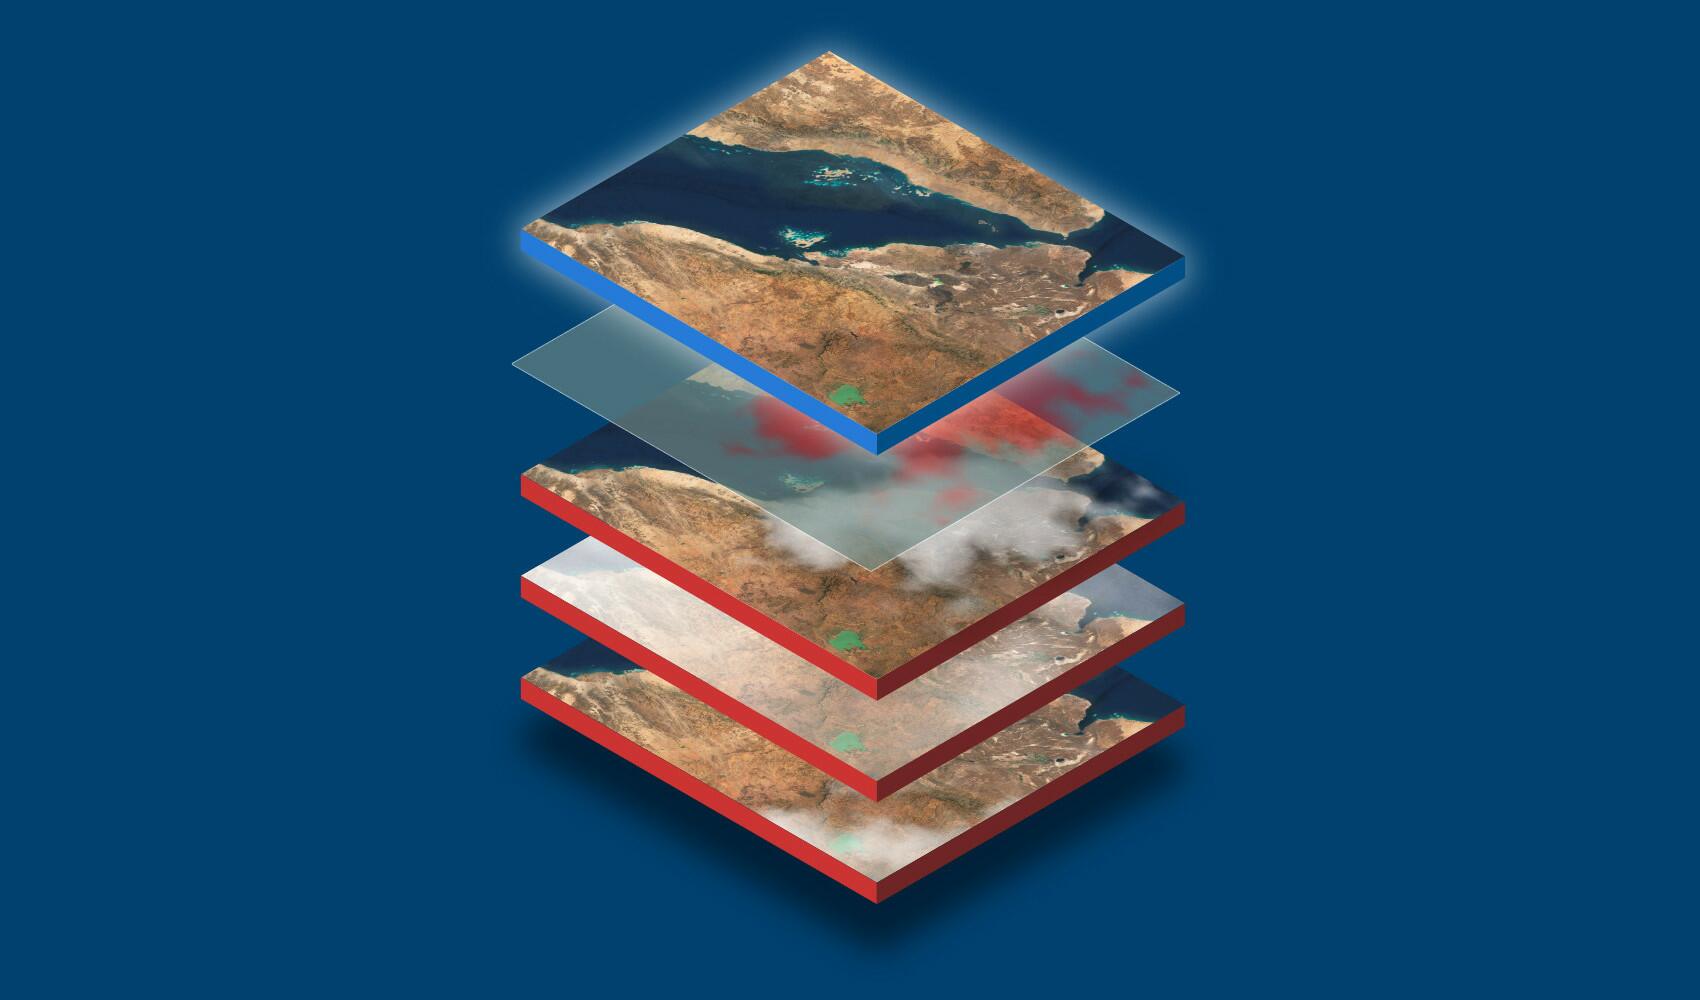
The term Analysis Ready Data (ARD) describes data which is preprocessed for immediate further use. For Sentinel-1 and other SAR data, calibration and corresponding terrain correction would be an example of such a preprocessing chain. For optical data this can mean for example cloud removal and atmospheric correction and for some specifications it also means bringing multiple datasets to a common grid. When using data from different sensors (e.g. optical sensors like Landsat and Sentinel-2) it could mean the data is preprocessed in such a way that data from different sensors can be compared directly (e.g. Landsat NIR band and Sentinel-2 NIR band). This facilitates further usage such as Machine Learning (ML), image classification, creating derivatives like Vegetation Indexes.
The availability of ARD saves resources needed to deal with the huge amount of raw satellite imagery. We offer ARD in a form of high quality homogeneous mosaics over large areas. The mosaics can be traced back to its origin for pixel selection methods or can be statistical for which the pixel origin information is lost.
Taking the EU Common Agricultural Policy (CAP) into consideration, the DIAS have received tasks and interests to improve their data collections especially the ones related to land use and agricultural applications like crop classification and crop monitoring, leading to the birth of CAP Analysis Ready Data (CARD) . We at EOX are a partner in the DIAS MUNDI (opens new window) and are developing more efficient ways how to disseminate the Sentinel-1 and Sentinel-2 data and information. Based on the experience of processing huge amount of satellite imagery (see s2maps.eu (opens new window)) we have developed state of the art processing environment for SAR and optical imagery. Thus introducing products ready to be used as CARD.
The Level-3 data reference used below is the same according to the definition from CESBIO (opens new window) (see: http://www.cesbio.ups-tlse.fr/multitemp/?p=13976 (opens new window)) for both Sentinel-1 and Sentinel-2 processing.
# Sentinel-1 Level-3 Backscatter Mosaics
The first example of our work was extensive Sentinel-1 processing. We have went through all data available for the year 2018 over Denmark and generated comprehensive SAR signal statistics at 10[m] resolution. These were created to be further used to hone Machine Learning (ML) to be exploited for agricultural Land-Use Classification (opens new window).
The results are visualized in this preview (opens new window), the data itself is publicly available for free on Open Telekom Cloud (OTC) bucket: eox-public.obs.eu-de.otc.t-systems.com (opens new window). (This data and its preview is mostly for demonstration of various tools so it is subject to change.)
The gif below shows RGB composite of average values of the Normalized Flattened Scattering Radar Cross Section (Gamma0) every 14 days of 2018.
Denmark 14 days L3 Mosaics- Sentinel-1 Gamma0
The research background for this project was Machine Learning (ML) algorithm improvement for food security in the Phi-Lab (opens new window) in ESRIN (European Space Agency). We have agreed to setup a processing environment with the result of bi-weekly Gamma0 statistics mosaic over Denmark 2018. The data of the statistic are the dual polarization (IW VV/VH) decibel values of 14-days average, minimum, maximum and standard deviation, as well as corresponding count of input data, per pixel.
# Sentinel-1 Level-3 Coherence Mosaics
Coherence is a value which describes how similar two SAR measurements are based on their signal properties (Definition (opens new window)). Therefore it is generally used to describe changes at a location, for instance if we have high coherence, almost nothing has changed between two or more acquisitions, for instance urban areas tend to stay similar. Low coherence comes from surfaces that change frequently based on wind, precipitation, or other (surface) movement. Somewhere in between is bare soil and similar entities.
Coherence is a normalized value from 0 to 1. In the image below red are values from 0.0-0.25, orange 0.25-0.5, yellow 0.5-0.75 and green 0.75-1.0. The original values are stretched to 256 colorspace for visualization with customized geotiff.js (opens new window). Original pixel size is 20[m].
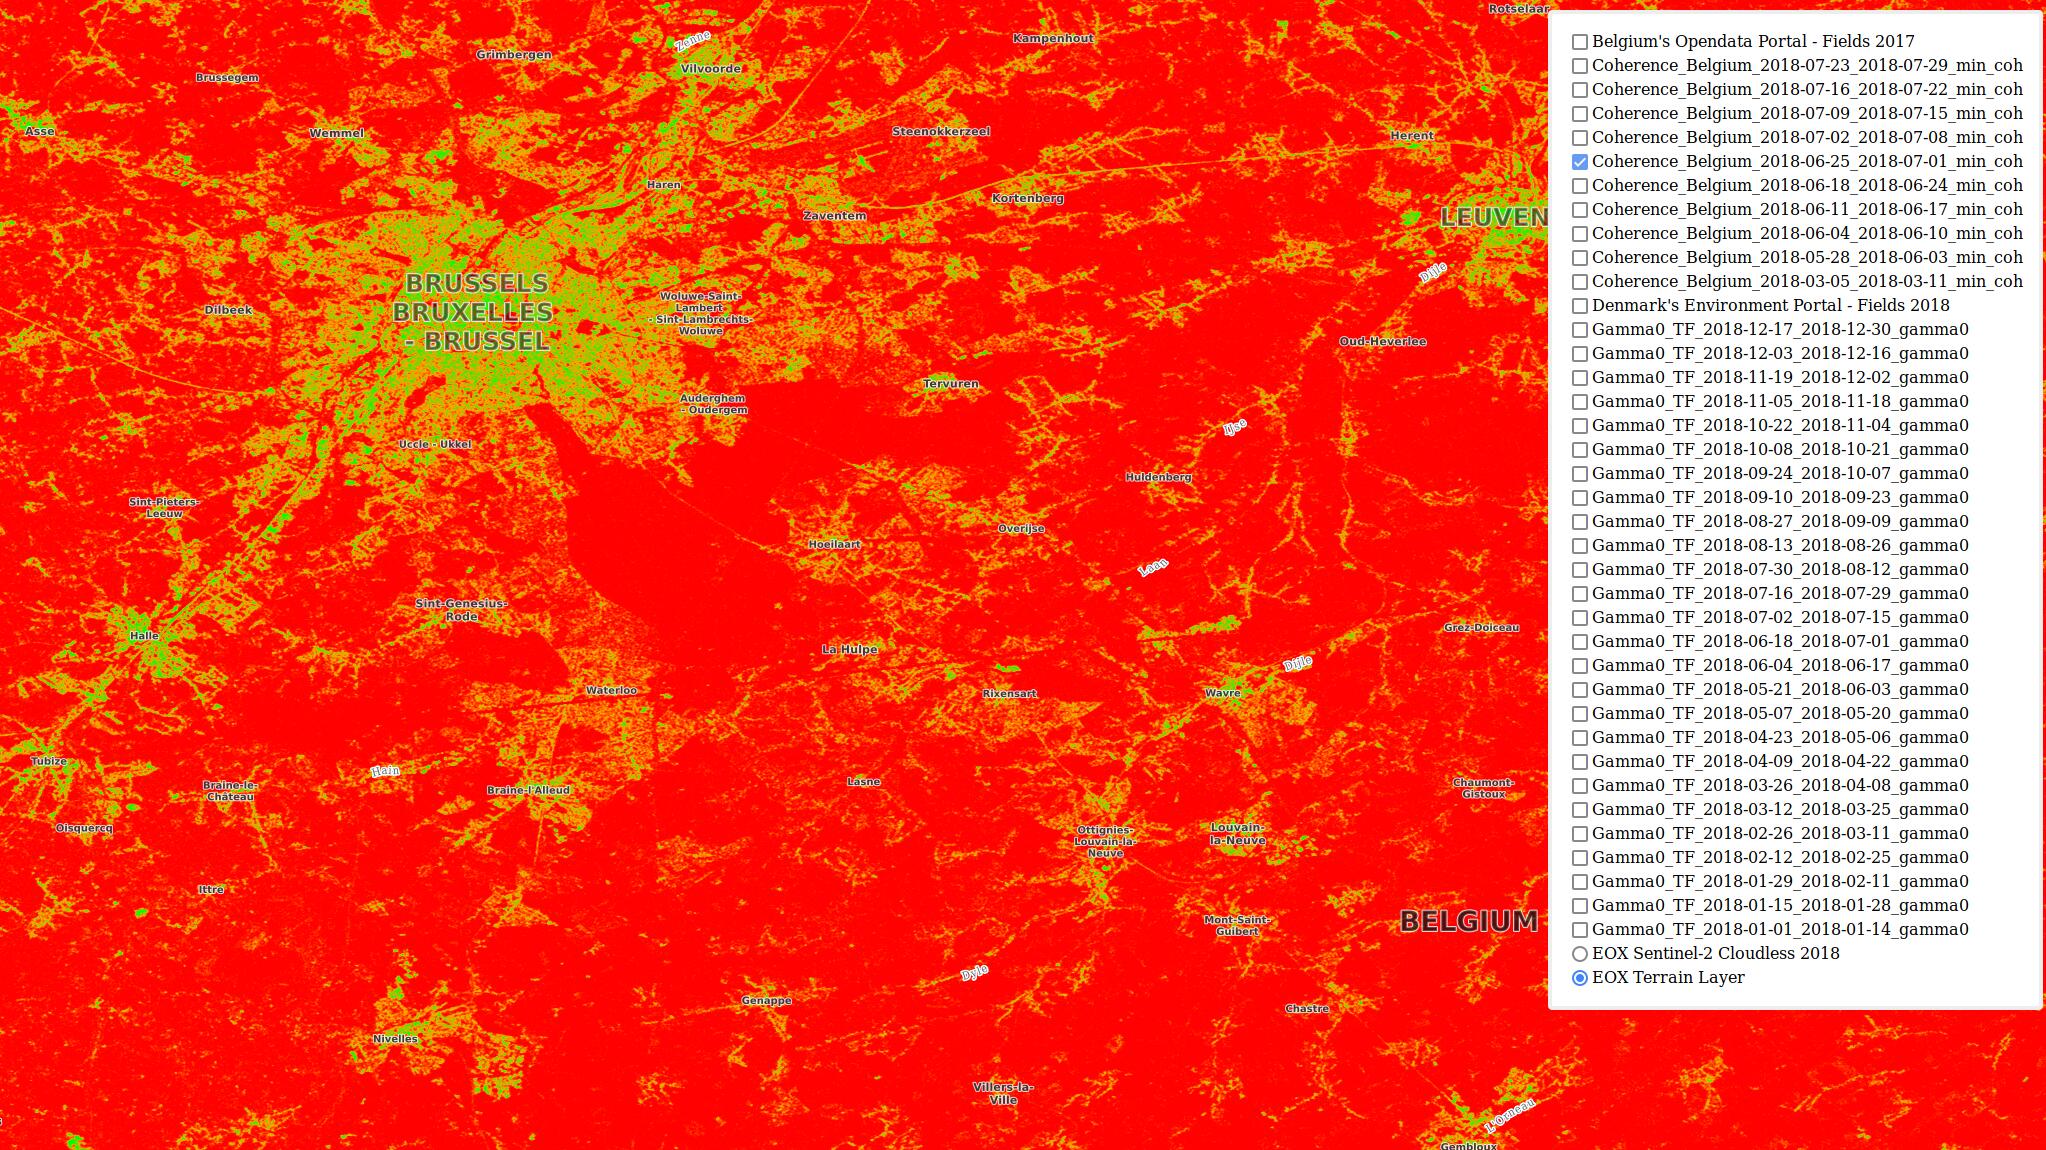
Belgium 7 days L3 Mosaics- Sentinel-1 Min. Coherence 25.06.-01.07.2018
This data comes from the enhanced data collection offered by MUNDI (opens new window), currently available for Denmark (opens new window), Belgium (opens new window) and Italy. Under Denmark and Belgium there are the opensearch links where the data can be found and accessed publicly for free (If you are interested in other Sentinel-1 Level-2 data, please contact EOX or MUNDI (opens new window), MUNDI Level-2 Gamma0 is available for Denmark and Italy 2018).
The difference between Level-2 and Level-3 products in this case is, that the Level-2 products are disseminated in the same extend and similar product structure as the Level-1 products, with the added value via the processing. The EOX Level-3 products are reduced to single data product for defined time range and AOI. The reduction is usually performed as a statistic of the measurements. Depending on its nature the results can be selective (e.g.: Min or Max, ...) or statistical (e.g.: Average, Standard Deviation, Linear Models, ...).
Additional public datasets like the one in the image above (minimum Coherence L3 Mosaics) are available as mosaics via the same interface like the Sentinel-1 Backscatter Mosaics here: eox-public (opens new window) (OTC Bucket (opens new window)).
# Sentinel-2 Level-3 Mosaics
Regarding the optical satellite imagery the latest Sentinel-2 Mosaics we've made were the monthly mosaics over Austria for the year 2018. The mosaics were delivered as satellite background maps at 10[m] resolution.
It has been made from the Sentinel-2 Level-2A data by a pixel selection method and each pixel is traceable to the original product. Currently available (not publicly) in EPSG:31259 and bands (red, green, blue, NIR). The data is collected from the primary month with previous or following month as fallback to reduce no-data values as much as possible (clouds, snow, etc.). The selection method for each pixel is to search for maximum NDVI (opens new window) and CVI (opens new window) (Chlorophyll Vegetation Index). The results are shown in the gif below.
The data itself having four spectral bands allows some basic analysis like monthly NDVI, EVI, CVI, NDWI. This clean dataset is ideal to feed to trained ML environment to classify or simulate Sentinel-2 optical imagery.
Austria monthly 2018 L3 Mosaics - Sentinel-2 Surface Reflectance
The Austria Mosaics were processed to serve as high resolution satellite maps for the GeoData Office (opens new window) of Burgenland, Austria.
# EOxCloudless
Should you be interested in processing for your Area of Interest (AOI) please visit https://cloudless.eox.at/ (opens new window). Under "Data Products - EOxCloudless Custom" we accommodate any individual needs regarding the Sentinel-1 or Sentinel-2 data requests.
Petr Ševčík, EOX IT Services GmbH Email: petr.sevcik@eox.at
Contains Modified Copernicus Sentinel-1 and Sentinel-2 Data 2018.