Vector tiles with dynamically updated style in Leaflet LPvis
TL; DR, Leaflet & VectorGrid (opens new window) Demo app LPvis (opens new window) showing conformity of farmer crop declaration vs trained classification ML results using API-updated static vector tiles can be seen here: lpvis.hub.eox.at (opens new window)
# Why vector tiles?
For a swift introduction into what a Vector Tile is, Mapbox’s Vector Tiles (opens new window) (MVT) website states the following description:
Vector tiles make huge maps fast while offering full design flexibility. They are the vector data equivalent of image tiles for web mapping, applying the strengths of tiling — developed for caching, scaling and serving map imagery rapidly — to vector data.
There are a lot of resources already available about it, as Vector Tiles have been receiving attention for some years now, so I won’t delve into too much detail. It’s a vector data encoding in the form of binary data tiles, geared towards reduced data size, bandwidth reduction due to caching as much as possible and (potentially) improved rendering performance. A big advantage is that styling and raw data are separate in nature. Attribute changes of few selected already loaded features (bringing in a change of styling) can lead to modifying only very little low volume of information on client side, instead of the necessity to reload a whole tile. In the same way, global data can be styled on the client side in multiple ways on demand while only one set is cached.
But none of that answers the question why we have started to be interested in the Vector Tiles ourselves!
# Motivation
First some pieces of context. Land Parcel Identification System (LPIS) is an IT system based on high resolution satellite images for editing the graphical and descriptive information about agricultural land. It is very actively used to check payments made under the Common Agricultural Policy (opens new window) (CAP) which were approximately 45.5 billion euro (opens new window) in total 2015. CAP is an economical ecosystem to sustain and support agriculture throughout Europe. From 2020 onward crop monitoring with help of remote sensing should be established across Europe, under wings of respective paying agencies (opens new window) as a part of modernization of the CAP ecosystem. These topics are however more thoroughly described in our previous posts: EOxCloudless for Common Agricultural Policy and EOxCloudless Sentinel-1 and Sentinel-2 Analysis Ready Data.
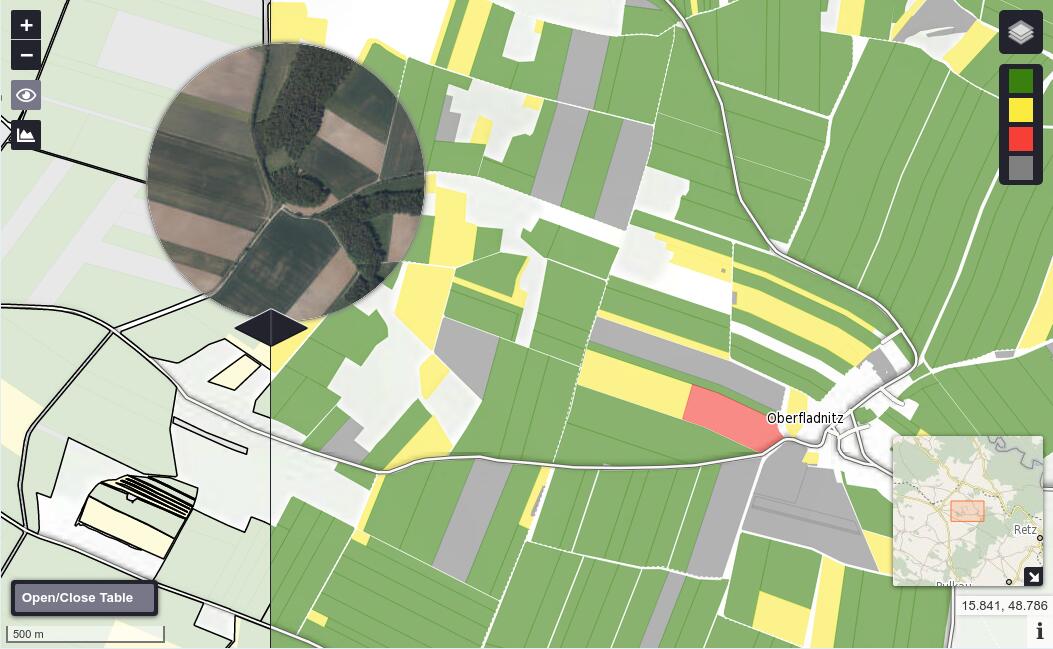
One of many tasks, which paying agencies have to face frequently in their agenda is monitoring if farmer declaration of what grows on their fields corresponds to the truth. Under normal circumstances, this means random field inspections, which increase labor costs unnecessarily. What if we could reduce those costs to a minimum by not having to send people to the field unless absolutely necessary? For example Machine Learning trained classification algorithms backed by collected ground truth data and openly accessible worldwide satellite data from Sentinel 1 and Sentinel 2 can yield very accurate estimates of crop type. These classification results should be distributed on parcel level to allow direct evaluation of conformity of farmer declaration. In order to allow a direct conformance, overview and verification tool for paying agencies, we have prepared a Leaflet demo application called LPvis (opens new window) - currently with Austrian LPIS data and inputs from AgrarMarkt Austria (opens new window) (AMA). Let's see, what powers the app, shall we?
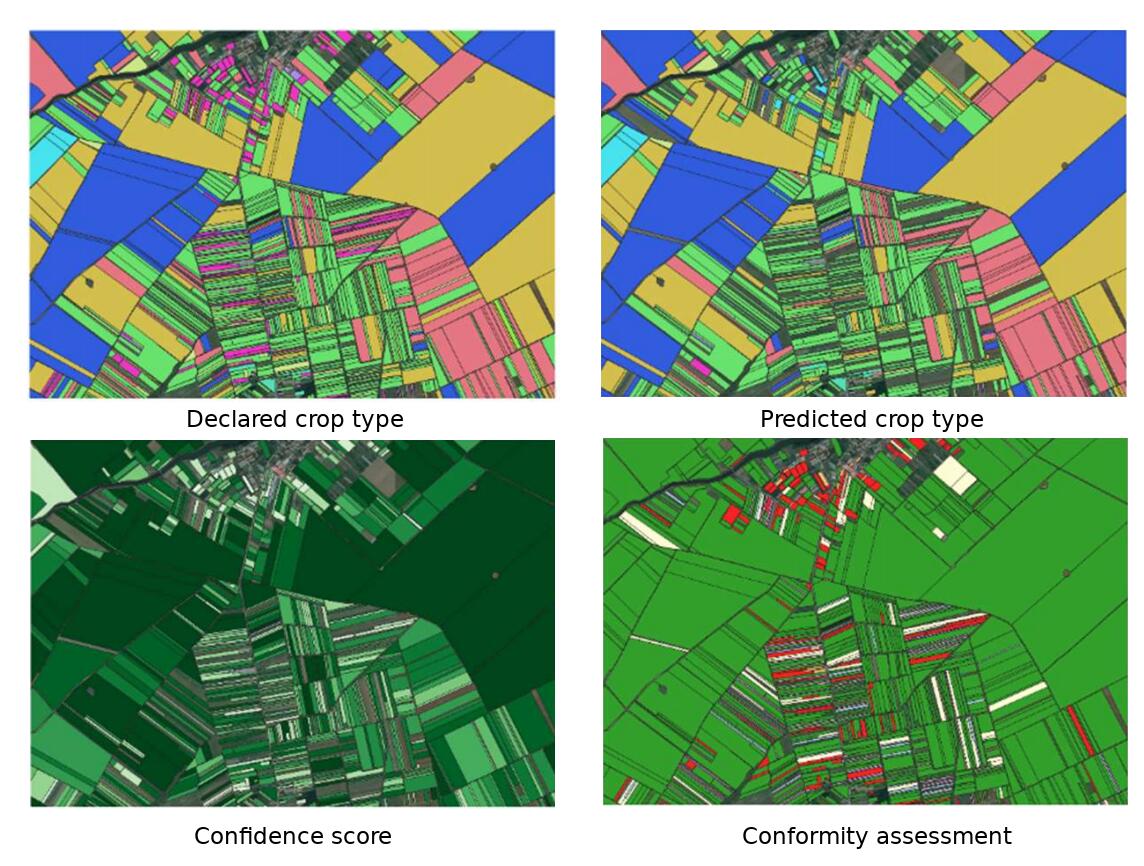
Visualization of attributes that lead to a final conformity map source: KOETZ Benjamin, DEFOURNY Pierre, SEN4CAP output for monitoring, link (opens new window)
# Leaflet VectorGrid to action
Most of our web applications are based on either OpenLayers or Cesium libraries. As the borders and differences between OpenLayers and Leaflet are nowadays not very sharp, it is more a matter of taste, which one you choose, as differences between functionalities are mostly minor. In general, Leaflet is designed as easy-to-use and light-weight library, where extra features are added with numerous plugins, while OpenLayers offers most of functionality out of the box. For LPvis, we have decided to use Leaflet 1.5.1 with Leaflet VectorGrid (opens new window) as a testing setup.
Leaflet Vector Grid is one of the possible plugins how to display MVT in Leaflet. It displays gridded vector data - sliced GeoJSON (opens new window), TopoJSON (opens new window) or protobuf MVT (opens new window). Below is a code example loading such a layer to Leaflet map.
const map = L.map('map').setView([50.102223, 9.254419], 4) // create a basic map
const AGRICULTURAL_PARCELS_URL_TEMPLATE = '/tiles/agricultural_parcels/{z}/{x}/{y}.pbf' // prepared local tiles or remote url
const agricultural_parcels = L.vectorGrid.protobuf(AGRICULTURAL_PARCELS_URL_TEMPLATE, {
  rendererFactory: L.svg.tile, // canvas was pixelated with tooltip artifacts
  interactive: true,
  maxNativeZoom: 16, // minZoom must be higher than minNativeZoom
  minZoom: 14,
  vectorTileLayerStyles: {
    agricultural_parcels: properties => {
      return trafficLightStyle(properties.match, properties.accuracy, false)
    }
  },
  getFeatureId: feature => feature.properties.AGRICULTURAL_PARCELS_UNIQUE_IDENTIFIER, // to allow further matching with classification results
}).bindTooltip('', { sticky: true }).addTo(map)
2
3
4
5
6
7
8
9
10
11
12
13
14
LPvis currently expects LPIS data and administrative boundaries as vector tiles in uncompressed pbf format using an ZXY scheme. The important part of the setup is that styling is applied on all features. As we are working with parcels (field polygons), a sort of traffic light style based on the match of declaration and classification (feature.match) with a certain confidence threshold (feature.accuracy) was used.
// Simplified version of traffic light style without highlighting and hiding of features
const parcel_style = {
  weight: 0.3,
  fill: true,
  fillOpacity: 0.6
}
function trafficLightStyle (match, accuracy) {
  if (accuracy < 0.95) return {
    fillColor: 'yellow', // classification not confident enough
    color: 'yellow',
   ...parcel_style
  }
  else if (match === true) return {
    fillColor: 'green', // matches declaration with enough confidence
    color: 'green',
    ...parcel_style
  }
  else if (match === false) return {
    fillColor: 'red', // different than declaration with enough confidence
    color: 'red',
    ...parcel_style
  }
  else return {
    fillColor: 'grey', // no classification data
    color: 'grey',
    ...parcel_style
  }
}
2
3
4
5
6
7
8
9
10
11
12
13
14
15
16
17
18
19
20
21
22
23
24
25
26
27
28
# Dynamic updating vs dynamic serving
There are multiple ways of providing vector tiles. The final choice heavily depends on multiple considerations. Firstly the number of parallel users and secondly the interval in which data are changing taking into account if only a single attribute (prediction) or whole geometries and all attributes changes. Thirdly, if users of the app will be working only on low tier devices or bad network environment, having to load & update several thousand polygons can be a huge problem. If that would be your case, a quite thorough talk from Max Malynowsky (REACH Initiative) held on FOSS4G 2019 (opens new window) can be of much help. The main options are:
Dynamic MVT with all parameters necessary created on the fly by a back end service (for example PostGIS and ST_AsMVT (opens new window) function) - ideal for attributes and geometries changing often or low amount of users at the same time. Even in this case, vector tiles still can and should be cached at least between data changes, unless that happens more than hourly lets say. Such an approach is well described here (opens new window).
Static MVT directly served to the user with all attributes being the originally planned use-case of vector tiles. This enables heavy caching and/or low price storage like s3. Ideal for not often changing data but also needs some extent of tailored pre-processing before. A decision needs to be made beforehand which hierarchy levels of data are displayed on which zoom to avoid extensive size increase of not well optimized geometries - for example by using a tool Tippecanoe (opens new window).
API updated Static MVT served to a user with just a geometry, which changes rarely. Other attributes used for visualization are then fetched dynamically from back end and merged with features already drawn on the client for example by a shared ID. This kind of approach can be used well during development and for data with often changing attributes. In our case of LPIS conformance checking, it would be during the process of training and improving performance of the ML classification. Server side caching of used MVT is again a good idea.
# LPvis mocked data demo
The initial step of the development was a front end only demo of LPvis (opens new window) using static MVT of agriculture parcels with already included match and accuracy properties - mocking classification results, prepared by Stefan Brand (opens new window) during his internship at EOX. Traffic light symbology shows conformity and a sidebar with mocked NDVI (opens new window) timestack chart lets you dig deeper into data in case of non-conformance comparing different crop vegetation index timestacks. The demo itself features many custom Leaflet UI plugins and shows LPIS parcels with mocked results of most of Austria and can be viewed on this link (opens new window).
# LPvis usecase of Euro Data Cube
The European Space Agency (ESA) (opens new window) has initiated a European Data Cube Facility Service (opens new window) project to enable millions of people around the world getting EO and non-EO data in a convenient manner. It contributes to the strategy to bring EO data from the restricted Space Community to the larger GIS Community and finally to the end-users assisting them at various tasks. In order to reach this goal, EOX and other consortium partners will integrate and expand existing services to establish the one service for all kinds of processing.
To expand Euro Data Cube sample application deployments, LPvis was updated to utilize its back-end capabilities - namely Euro Data Cube geoDB. Here eurodatacube (opens new window)/ (opens new window)LPvis (opens new window) ships bundled LPIS static vector tiles from a small part of Austria and fetches a geoDB stored ML crop type classification results to update the MVT styling on client side. It also accesses Euro Data Cube Sentinel-Hub Service (opens new window) - namely NDVI timestacks for concrete LPIS parcel in the format of the Sentinel Hub FIS (opens new window) as another dynamic source of validation data. Details of the classification itself will not be presented here yet but probably in one of next blog posts.
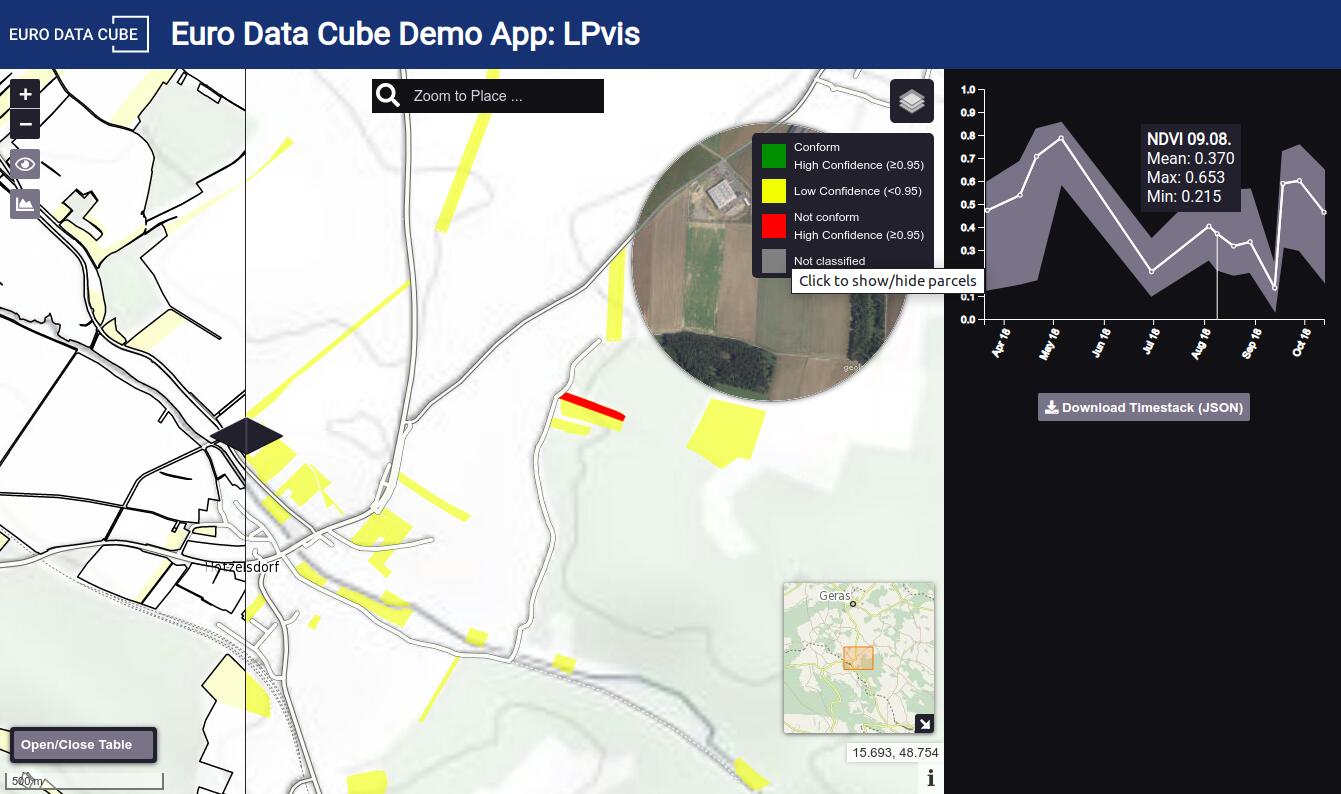
Filtering out conforming parcels together with NDVI timestack sidebar
From the implementation point of view, this presented a challenge of updating the MVT parcels after classification results are received. A mapping parcel_id -> tile needed to be set up and updated after each fetch, also taking in consideration that a single parcel can be present on more tiles.
We want to thank CAP Paying Agency Agrarmarkt Austria, represented by Bernhard Eder and Angela Trischak, for providing user requirements and practical insights into Austrian parcel data used in the demo example.
# More information
Should you be interested in further developments in Euro Data Cube, please use the chatbot on eurodatacube.com (opens new window) to subscribe to our newsletter. If you are interested in LPvis specifically, leave us a note. Any contributions are more than welcome. For questions, feedback and feature proposals open an issue (opens new window). For minor bug fixes you can create a PR (opens new window) right away. Lubomír Bucek, EOX IT Services GmbH Email: lubomir.bucek@eox.at