Earth Observation Data Cubes as a Service
Editor’s Note: The information in this blog post is part of Stefan’s master’s thesis (opens new window), that he wrote as an intern at EOX.
Have you wondered how to extract meaningful information from loads of satellite imagery spanning several months? You are not alone! Satellite imagery is considered Big Earth Data and comes with a specific set of challenges. Earth Observation Data Cubes have set out to tackle these challenges. They allow for easy information extraction, for example in the agricultural domain.
# Checks by Monitoring
In an effort to modernize the Common Agricultural Policy (CAP) (opens new window) the European Union is introducing a new concept called Checks by Monitoring (CbM). The idea is to automatically check all farmers’ subsidy requests using satellite imagery. To this end time stacks of satellite data are overlain by agricultural parcels and typical vegetation "signals" are modeled for each crop.
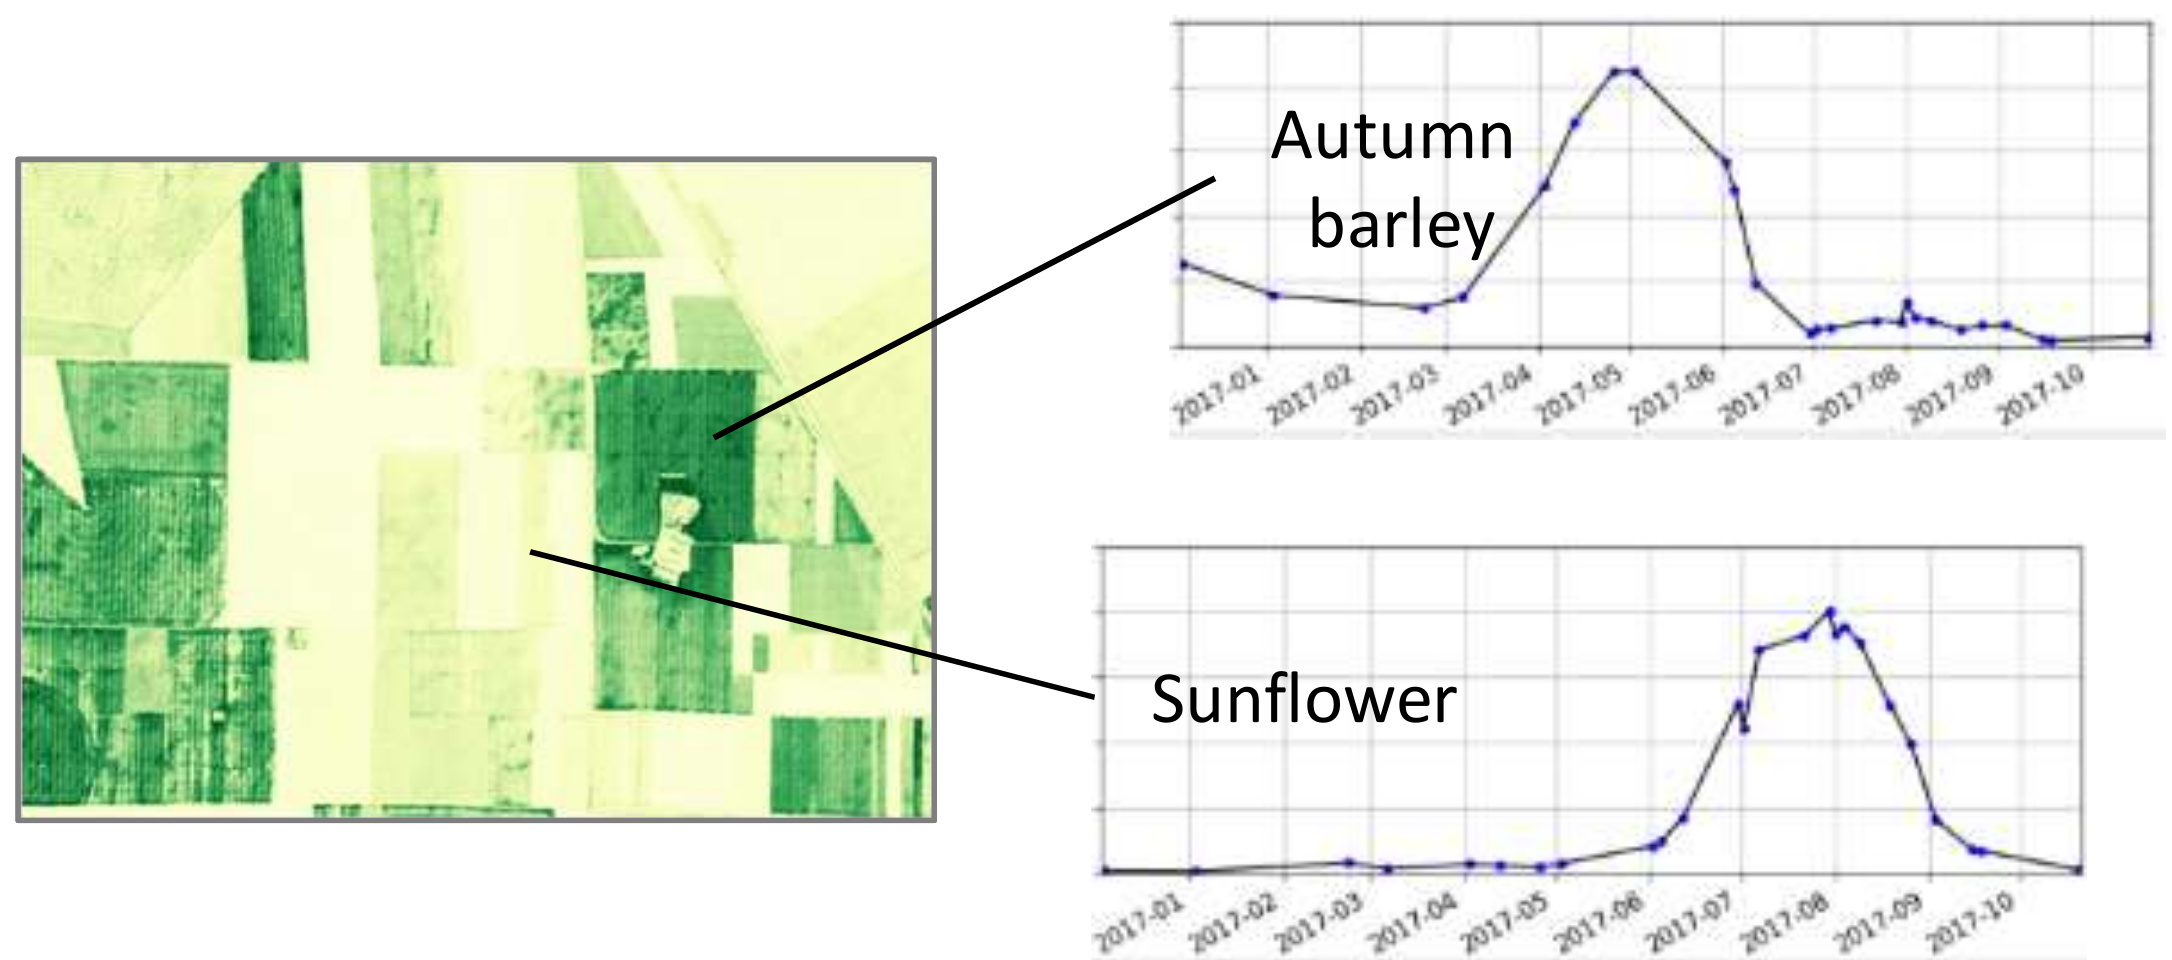
Then the actual signals of all agricultural parcels are compared to the typical signal models corresponding to the farmers’ declarations. If the declaration and the actual signal agree, the parcel is flagged as compliant. Else, further investigations are triggered, and the farmer is given the chance to review their declaration.
Working on putting the CbM concept into practice EOX has partnered with the Austrian paying agency Agrarmarkt Austria (AMA). Together we are exploring the various steps of the CbM workflow in a hands-on fashion.
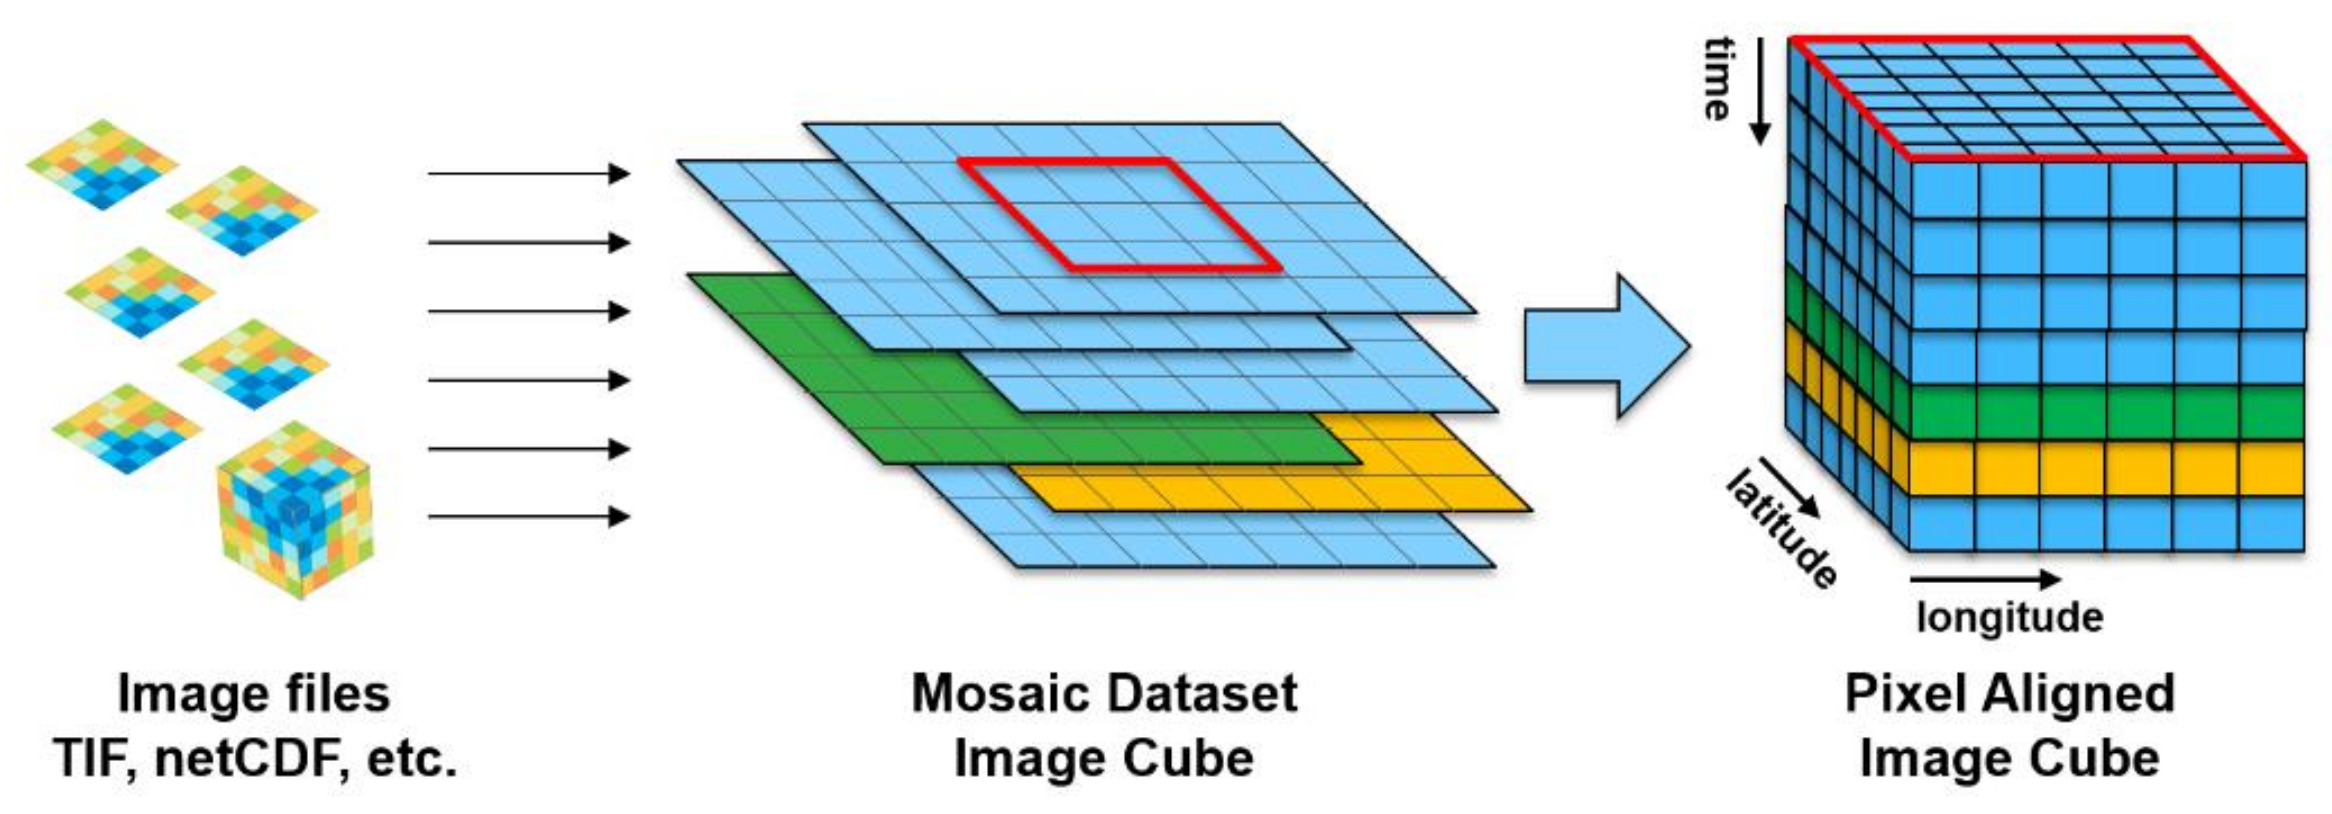
# Earth Observation Data Cube
At the beginning of the CbM workflow satellite imagery has to be pre-processed into a form that is more suitable for time series analysis. Earth Observation Data Cubes are an emerging paradigm in the remote sensing realm. Over an area of interest (AOI) images are mosaicked together and then these mosaics are stacked on top of each other. This way we receive a continuous, gridded data structure with at least three dimensions (time, x, y).
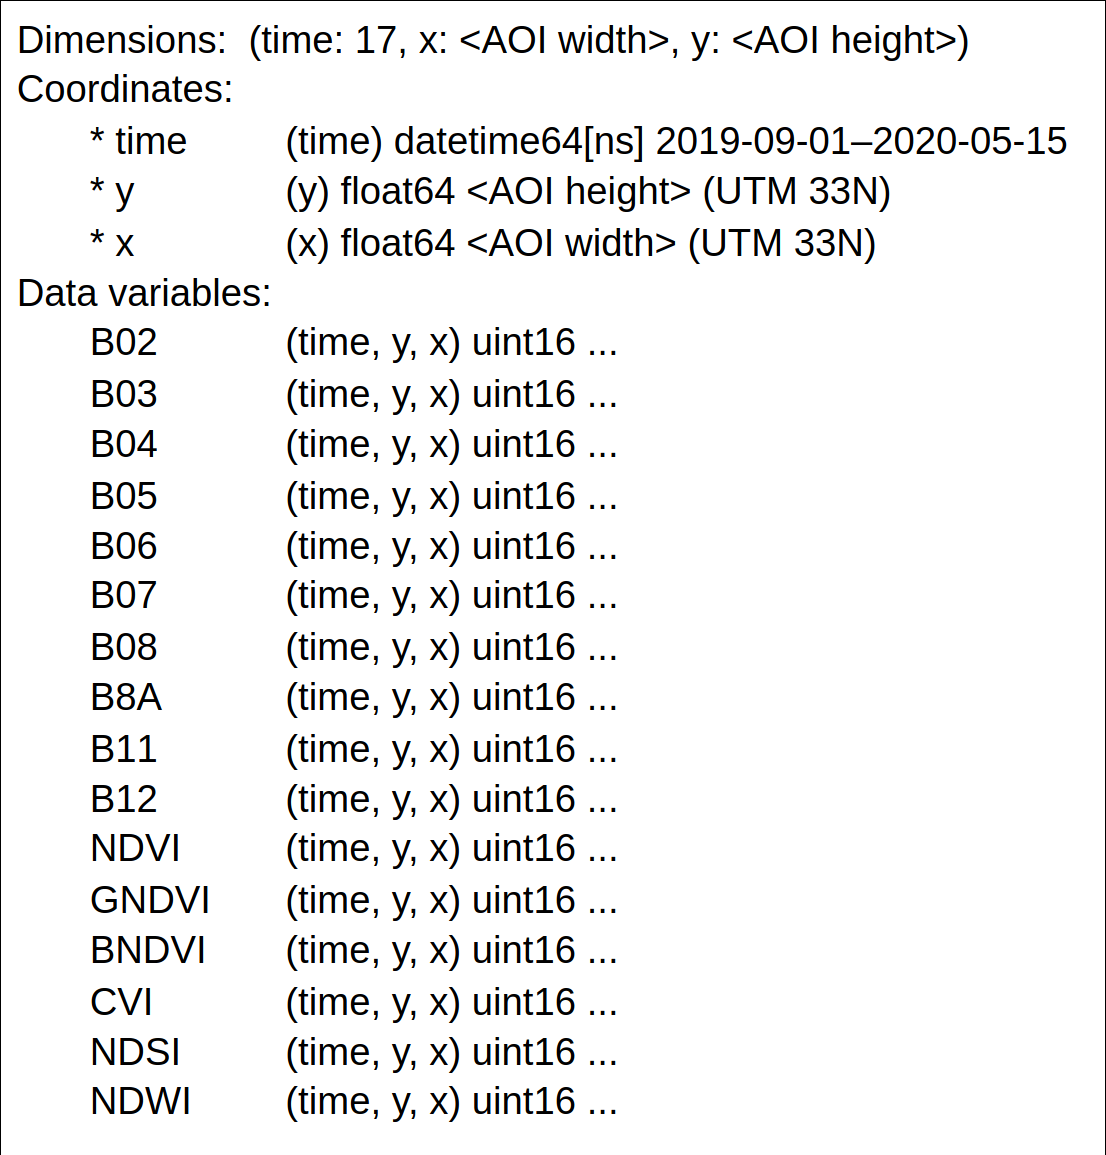
In the context of CbM we are using Sentinel-1 backscatter plus derived polarisation ratios and multiple bands of Sentinel-2 plus derived vegetation, water and salinity indices. Satellite data is processed using the EOX-developed mapchete Hub cloud service. A Sentinel-2 data cube schema that includes half-monthly data from the start of the winter season up to the first checks date is detailed below.
# Tiles Processing
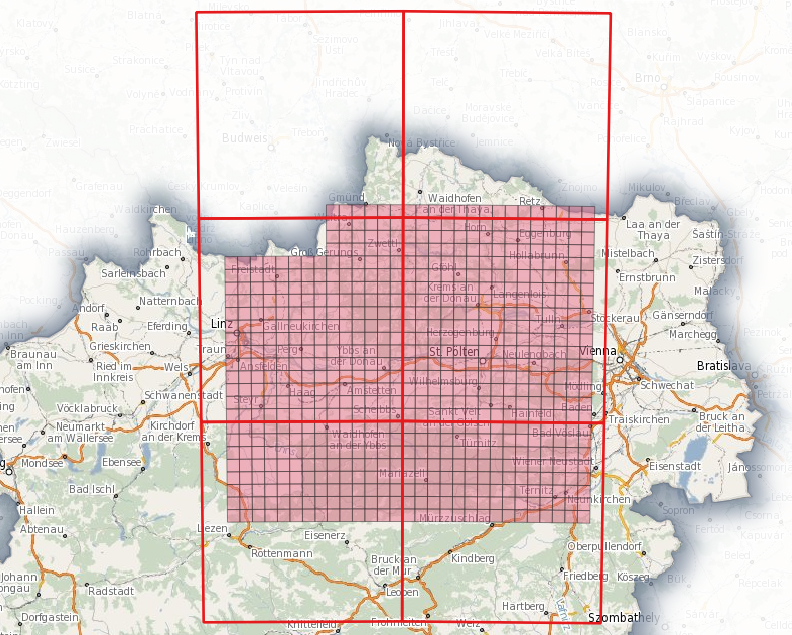
Since the project AOI covers about 17,000 km² we tiled the input data into smaller chunks to speed-up the processing. We created a custom WMTS tile pyramid and selected six process zones corresponding to the project AOI. These zones were in turn chunked again into smaller process tiles. While process zones are used to parallelize processing on multiple machines, process tiles are distributed among the available processor cores on each machine.
This setup allowed us to process 8.5 months of Sentinel-2 satellite imagery within 1:24 hours, including calculations of half-monthly averaged time slices and band indices. The resulting data cube with 17 time slices covering 17,000 km² is 48.37 GiB in size. Find the used processing script on GitHub (opens new window).
# Conclusion
The Earth observation data cube experiment presented above shows that EOX is perfectly equipped to deal with the satellite data pre-processing requirements for the upcoming CAP reform. Contact us and we will be glad to discuss your custom processing needs together.
# References
- Koetz, B., Defourny, P., Bontemps, S., Bajec, K., Cara, C., de Vendictis, L., Kucera, L., Malcorps, P., Milcinski, G., Nicola, L., Rossi, L., Sciaretta, C., Slacikova, J., Tutunaru, F., Udroiu, C., & Zavagli, M. (2019, October 4). SEN4CAP - Sentinels for CAP monitoring approach. https://ec.europa.eu/jrc/sites/jrcsh/files/14-sen4cap.pdf (opens new window)
- Kopp, S., Becker, P., Doshi, A., Wright, D. J., Zhang, K., & Xu, H. (2019). Achieving the Full Vision of Earth Observation Data Cubes. Data, 4(3), 94. https://doi.org/10.3390/data4030094 (opens new window)